On November 7, 2012, Energy Transfer Partners, L.P. (ETP) reported results of operations for 3Q 2012. I usually prefer to review trailing 12-months data but in this case nine-month data will have to suffice because restated prior data is available only for the quarter and nine-month period ending 9/30/11. Restatement was required because in October 2012, ETP sold ETC Canyon Pipeline, LLC (“Canyon”) for ~$207 million and reclassified Canyon’s results for the three and nine months ended September 30, 2012, as discontinued operations. Prior year amounts were accordingly restated and a $145 million non-cash write-down of the Canyon assets was recorded during the three months ended September 30, 2012. Note that the propane business is not considered a discontinued operation. It was contributed by ETP to AmeriGas Partners, L.P. (APU) in January 2012 in return for ~$1.46 billion in cash and ~29.6 million APU units (which ETP is obligated to hold until January 2013). Its results are accounted for under the equity method, similarly to the manner in which ETP accounts for its 50% interest in the Fayetteville Express Pipeline (“FEP”) and 50% interest in Citrus Corp. (“Citrus”) which owns the FGT natural gas pipeline.
The acquisition of Sunoco, Inc. (SUN) pursuant to which SUN shareholders received ~55 million ETP units plus $2.6 billion in cash was completed on October 5, 2012, and is therefore not yet reflected in ETP’s 3Q12 financials.
Revenues, operating income, net income and earnings before interest, depreciation & amortization and income tax expenses (“EBITDA”) are summarized in Table 1 below: 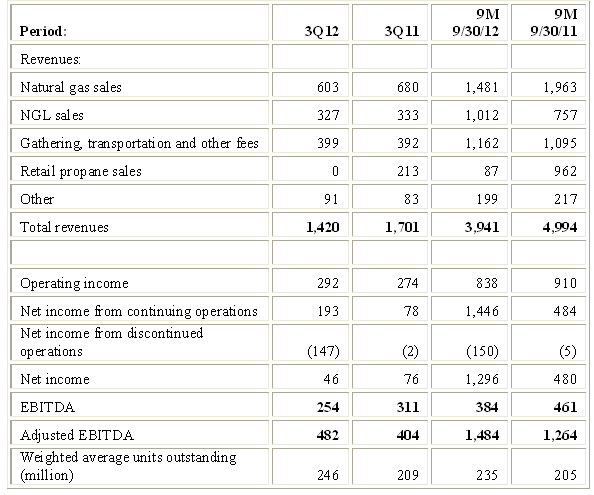
Table 1: Figures in $ Millions except units outstanding
Segment contribution to Adjusted EBITDA was as follows: 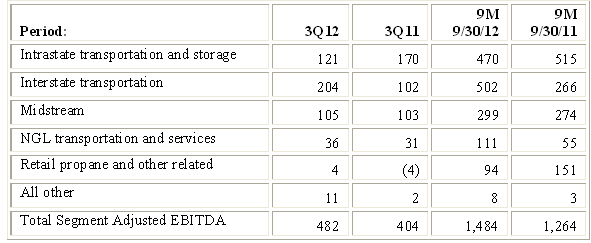
The lower Adjusted EBITDA levels at the Intrastate Transportation and Storage segment reflect lower transportation volumes and lower gross margins.
The higher Adjusted EBITDA levels at the Interstate Transportation segment reflect increase in transported volumes, primarily due to the Tiger pipeline expansion, and contributions from unconsolidated affiliates that began in 2012. Specifically, in the nine months ending 9/30/12 the 50% ownership stake in Citrus contributed $162.2 million and the 50% interest in FEP contributed $21.1 million to Adjusted EBITDA.
Higher transportation volumes, higher gross margins improved the year-to-date Adjusted EBITDA numbers for the Midstream segment.
The increase in NGL Transportation and Services segment Adjusted EBITDA primarily reflect a full nine months of activity for the Lone Star JV compared to only five months of activity in 2011
In an article titled Distributable Cash Flow (“DCF”) I present the definition of DCF used by ETP and provide a comparison to definitions used by other MLPs. Using ETP’s definition, DCF for the nine-month period ending 9/30/12 was $3.98 per unit ($935 million), down from $4.03 per unit ($827 million) for the comparable prior year period. As always, I first attempt to assess how these figures compare with what I call sustainable DCF for these periods and whether distributions were funded by additional debt or issuing additional units.
The generic reasons why DCF as reported by the MLP may differs from call sustainable DCF are reviewed in an article titled Estimating sustainable DCF-why and how. Applying the method described there to ETP results through 9/30/12 generates the comparison outlined in Table 3 below: 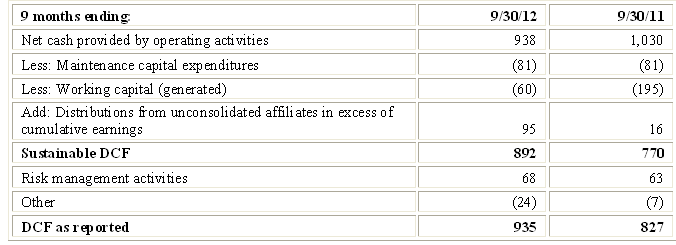
Some distributions from unconsolidated affiliates appear in the cash flow statement as cash provided by operating activities while others appear under cash from investing activities. I did not see an explanation for this. My assumption is that distributions from unconsolidated affiliates that appear in the cash flow statement as cash provided by operating activities include: a) the 50% ownership stake in Citrus and, through that, a 50% stake in FGT, a natural gas pipeline system that originates in Texas, delivers natural gas to the Florida peninsula, and is 50% owned by Kinder Morgan, Inc. (KMI); and b) ETP’s 50% interest in FEP, a 50/50 joint venture with Kinder Morgan Energy Partners (KMP) built to serve the Fayetteville Shale producing region in Arkansas. I added to sustainable cash flow distributions from unconsolidated affiliates that appear under cash from investing activities and assume these consist principally of the 29.6 million shares of AmeriGas Partners, L.P. (APU) received by ETP (together with ~$1.46 billion in cash) upon ETP’s contribution of its propane business to APU in January 2012.
The differences between reported DCF and sustainable DCF in Table three relate to ETP’s risk management activities and to a variety of items grouped under “Other”.
In deriving its reported DCF, ETP adds back losses from risk management activities. This item totals $68 million in the nine months ended 9/30/12, the bulk of which is due to derivatives related to stored natural gas. ETP adds back this unrealized loss in calculating DCF while I do not.
Coverage ratios continue to be below 1.0 as indicated in Table 4 below: 
Incentive distributions to Energy Transfer Equity, L.P. (ETE), ETP’s general partner, are included and accounted for ~34% of total distributions for the TTM ended 9/30/12 and ~36% for the comparable prior year period. While reported DCF per unit has not really changed in recent years, sustainable DCF has improved slightly, which is an encouraging sign. This can be seen in Table 5 below: 
I find it helpful to look at a simplified cash flow statement by netting certain items (e.g., acquisitions against dispositions) and by separating cash generation from cash consumption. Here is what I see for ETP: 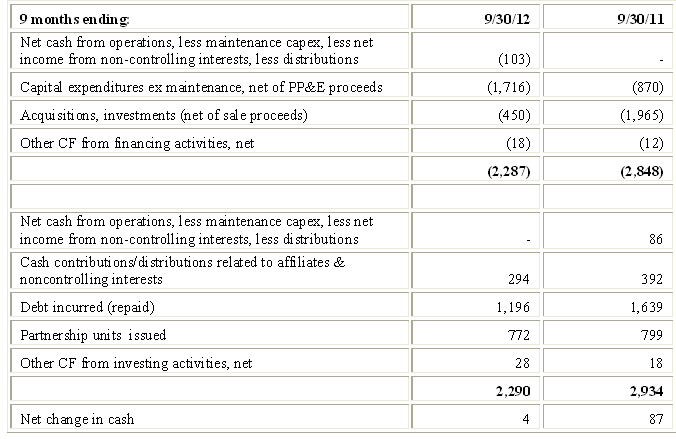
Net cash from operations, less maintenance capital expenditures, less net income from non-controlling interests fell short of covering distributions by $103 million in the nine-month period ending 9/30/12. However, some distributions from unconsolidated affiliates appear in the cash flow statement as cash from operating activities while others appear under cash from investing activities. I did not see an explanation for this. If I add back to cash from operations distributions the ~$95 million cash received during this period from unconsolidated affiliates that appears under cash from investing activities, the shortfall is reduced to $8 million. So only a very small portion of the period’s distributions were funded by issuance of units or debt.
ETP’s current yield of 8.50% is higher than almost all the other MLPs I cover: 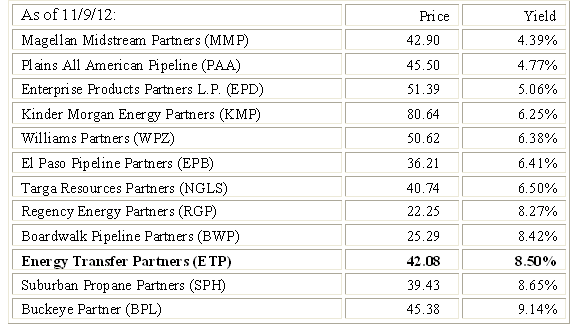
On the positive side, distributable cash flow, whether as reported or sustainable, seems very close to fully supporting this high yield. On the other hand, I am troubled by the complexities created by using ETP for some acquisitions, ETE for others and the resultant creation of ETP Holdco Corporation (“Holdco”) into which ETE contributed its interest in Southern Union for a 60% equity interest and ETP contributed its interest in SUN for a 40% controlling equity stake. Management acknowledges this will have to be untangled. ETP also now owns a retail gasoline business which is non-strategic and does not fit well structure-wise because it is a corporation and is subject to corporate taxes. Contrary to expectations, management stated it does not intend to dispose of that business and is seeking a structural solution to eliminate the tax inefficiencies. Also, management is contemplating folding RGP into ETP. I reduced my ETP position at prices ranging from $47.43 to $42.02 but am not currently considering further reductions.
- English (UK)
- English (India)
- English (Canada)
- English (Australia)
- English (South Africa)
- English (Philippines)
- English (Nigeria)
- Deutsch
- Español (España)
- Español (México)
- Français
- Italiano
- Nederlands
- Português (Portugal)
- Polski
- Português (Brasil)
- Русский
- Türkçe
- العربية
- Ελληνικά
- Svenska
- Suomi
- עברית
- 日本語
- 한국어
- 简体中文
- 繁體中文
- Bahasa Indonesia
- Bahasa Melayu
- ไทย
- Tiếng Việt
- हिंदी
Energy Transfer Partners: Distributable Cash Flow
Published 11/13/2012, 01:00 PM
Updated 07/09/2023, 06:31 AM
Energy Transfer Partners: Distributable Cash Flow
Latest comments
Install Our App
Risk Disclosure: Trading in financial instruments and/or cryptocurrencies involves high risks including the risk of losing some, or all, of your investment amount, and may not be suitable for all investors. Prices of cryptocurrencies are extremely volatile and may be affected by external factors such as financial, regulatory or political events. Trading on margin increases the financial risks.
Before deciding to trade in financial instrument or cryptocurrencies you should be fully informed of the risks and costs associated with trading the financial markets, carefully consider your investment objectives, level of experience, and risk appetite, and seek professional advice where needed.
Fusion Media would like to remind you that the data contained in this website is not necessarily real-time nor accurate. The data and prices on the website are not necessarily provided by any market or exchange, but may be provided by market makers, and so prices may not be accurate and may differ from the actual price at any given market, meaning prices are indicative and not appropriate for trading purposes. Fusion Media and any provider of the data contained in this website will not accept liability for any loss or damage as a result of your trading, or your reliance on the information contained within this website.
It is prohibited to use, store, reproduce, display, modify, transmit or distribute the data contained in this website without the explicit prior written permission of Fusion Media and/or the data provider. All intellectual property rights are reserved by the providers and/or the exchange providing the data contained in this website.
Fusion Media may be compensated by the advertisers that appear on the website, based on your interaction with the advertisements or advertisers.
© 2007-2024 - Fusion Media Limited. All Rights Reserved.
