It is aggravating to listen to detailed discussion on the employment situation. The difference between the initial guess of the employment numbers and the "final" guess can be significant. Too many overthink the monthly employment situation from the BLS.
Follow up:
Every month, the pundits pour over the employment situation detailing the good (usually the market pumpers), the bad (there is always something bad in employment), and the ugly (the doom-and-gloom brigade). Employment is the result of economic dynamics many months in the past. Employment essentially confirms where the economy had been months ago (our employment model averages selected economic dynamics over the trailing 6 months).
I look at employment reports with a broader brush. My position is that the monthly report is issued with too many extrapolations as the "complete" data will only be available many months following the initial employment report release. Yet, looking at the year-over-year data - employment growth remains relatively good despite September's relatively bad report.
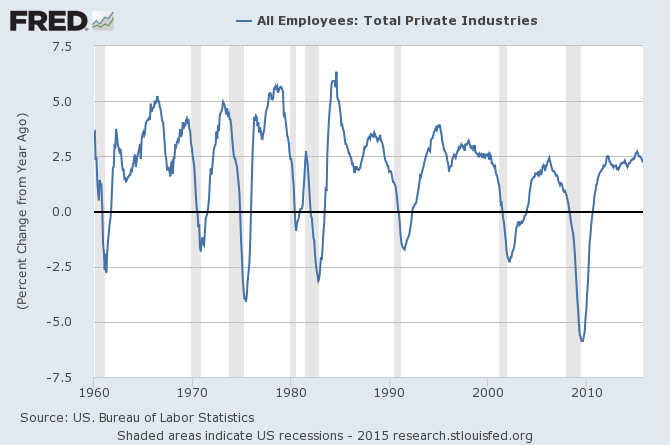
Below is the same graph as above - concentrating on the Great Recession and later periods.
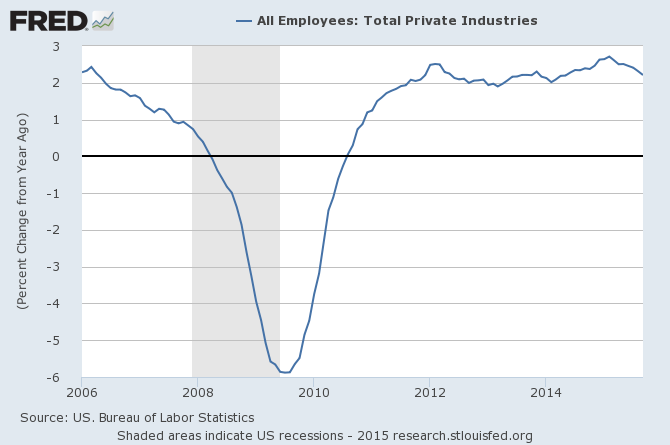
Repeating - employment is a lagging view of the economy. Econintersect creates a six month employment growth forecast based economic pressures we are seeing in real time. Our employment index began forecasting a decline in employment in our January 2015 economic forecast, which would indicate a slowing of employment growth in July 2015 based on economic pressures which historically correlate to employment growth.
We are currently predicting a pickup of employment growth in January 2016 - but we are forecasting the rest of this year with declining employment rate of growth.
The Econintersect Jobs Index projected non-farm private jobs growth of 150,000 for October 2015 - down from September's 160,000 forecast.
Comparing BLS Non-Farm Employment YoY Improvement (blue line, left axis) with Econintersect Employment Index (red line, left axis) and The Conference Board ETI (yellow line, right axis)
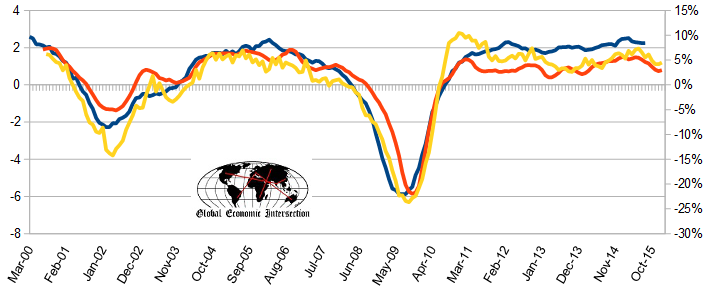
It is not just Econintersect making this forecast of a declining rate of jobs growth. The Conference Board's Employment Index which uses a completely different methodology is in lockstep with Econintersect projecting lower employment gains for the rest of 2015. Note that neither of us are forecasting recessionary employment gains.
HOWEVER, there is a real problem at the BLS in determining employment growth. Every month I point out that the household and establishment surveys usually do not match. The pundits look to the household survey primarily for the unemployment and participation rates - and the establishment survey for the detail on employment gains. This is crazy as the unemployment rate is based on a survey which is yielding less jobs gains as the establishment survey.
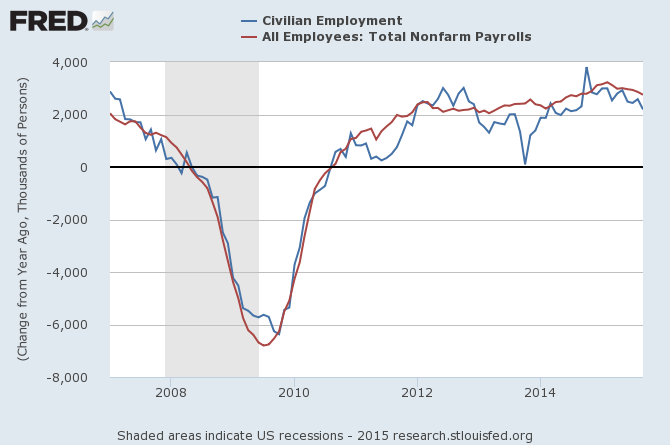
The graph above shows the BLS establishment non-farm payroll growth year-over-year (red line) compared to the household survey's civilian employment growth year-over-year. Over the last year, the household survey has averaged 45,000 per month fewer jobs gains. Understand that there are some differences between the surveys in who they determine is employed - but the size of the deviation is unacceptable.
I can analyze data - but if the data is wrong, the analysis is worthless. Garbage in, garbage out.
Other Economic News this Week:
The Econintersect Economic Index for October 2015 was statistically unchanged from September - and remains in the low range of index values seen since the end of the Great Recession. The tracked sectors of the economy generally showed some growth. Our economic index remains in a long term decline since late 2014.
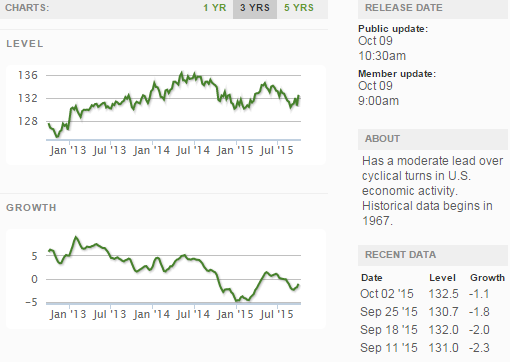
The ECRI WLI growth index is now in positive territory but still indicates the economy will have little growth 6 months from today.
Current ECRI WLI Growth Index
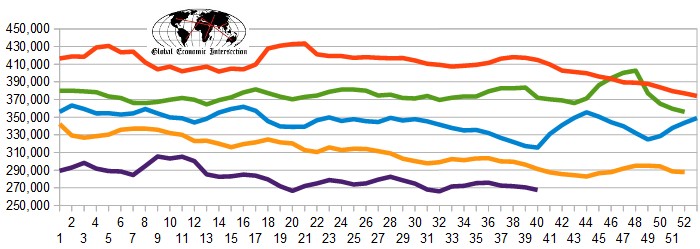
The market was expecting the weekly initial unemployment claims at 260 K to 275 K (consensus 272,000) vs the 263,000 reported. The more important (because of the volatility in the weekly reported claims and seasonality errors in adjusting the data) 4 week moving average moved from 270,500 (reported last week as 270,750) to 267,500. The rolling averages generally have been equal to or under 300,000 since August 2014.
Weekly Initial Unemployment Claims - 4 Week Average - Seasonally Adjusted - 2011 (red line), 2012 (green line), 2013 (blue line), 2014 (orange line), 2015 (violet line)
Bankruptcies this Week: American Apparel (N:APP), Privately-held Taylor-Wharton International
Weekly Economic Release Scorecard:
