The Emini has reversed up strongly for 3 weeks. There is no top yet. However, the rally is probably a bull leg in what will become a trading range. Traders should expect a 2 week bear leg to begin by the end of the month.
Bond futures had a blow-off top in March. They will probably be sideways to down for the rest of the year.
The EUR/USD Forex market has been in a trading range for 8 months. It is reversing up from the bottom of the range. Traders should expect higher prices next week.
30 year Treasury bond Futures market:
Blow off top in bull trend
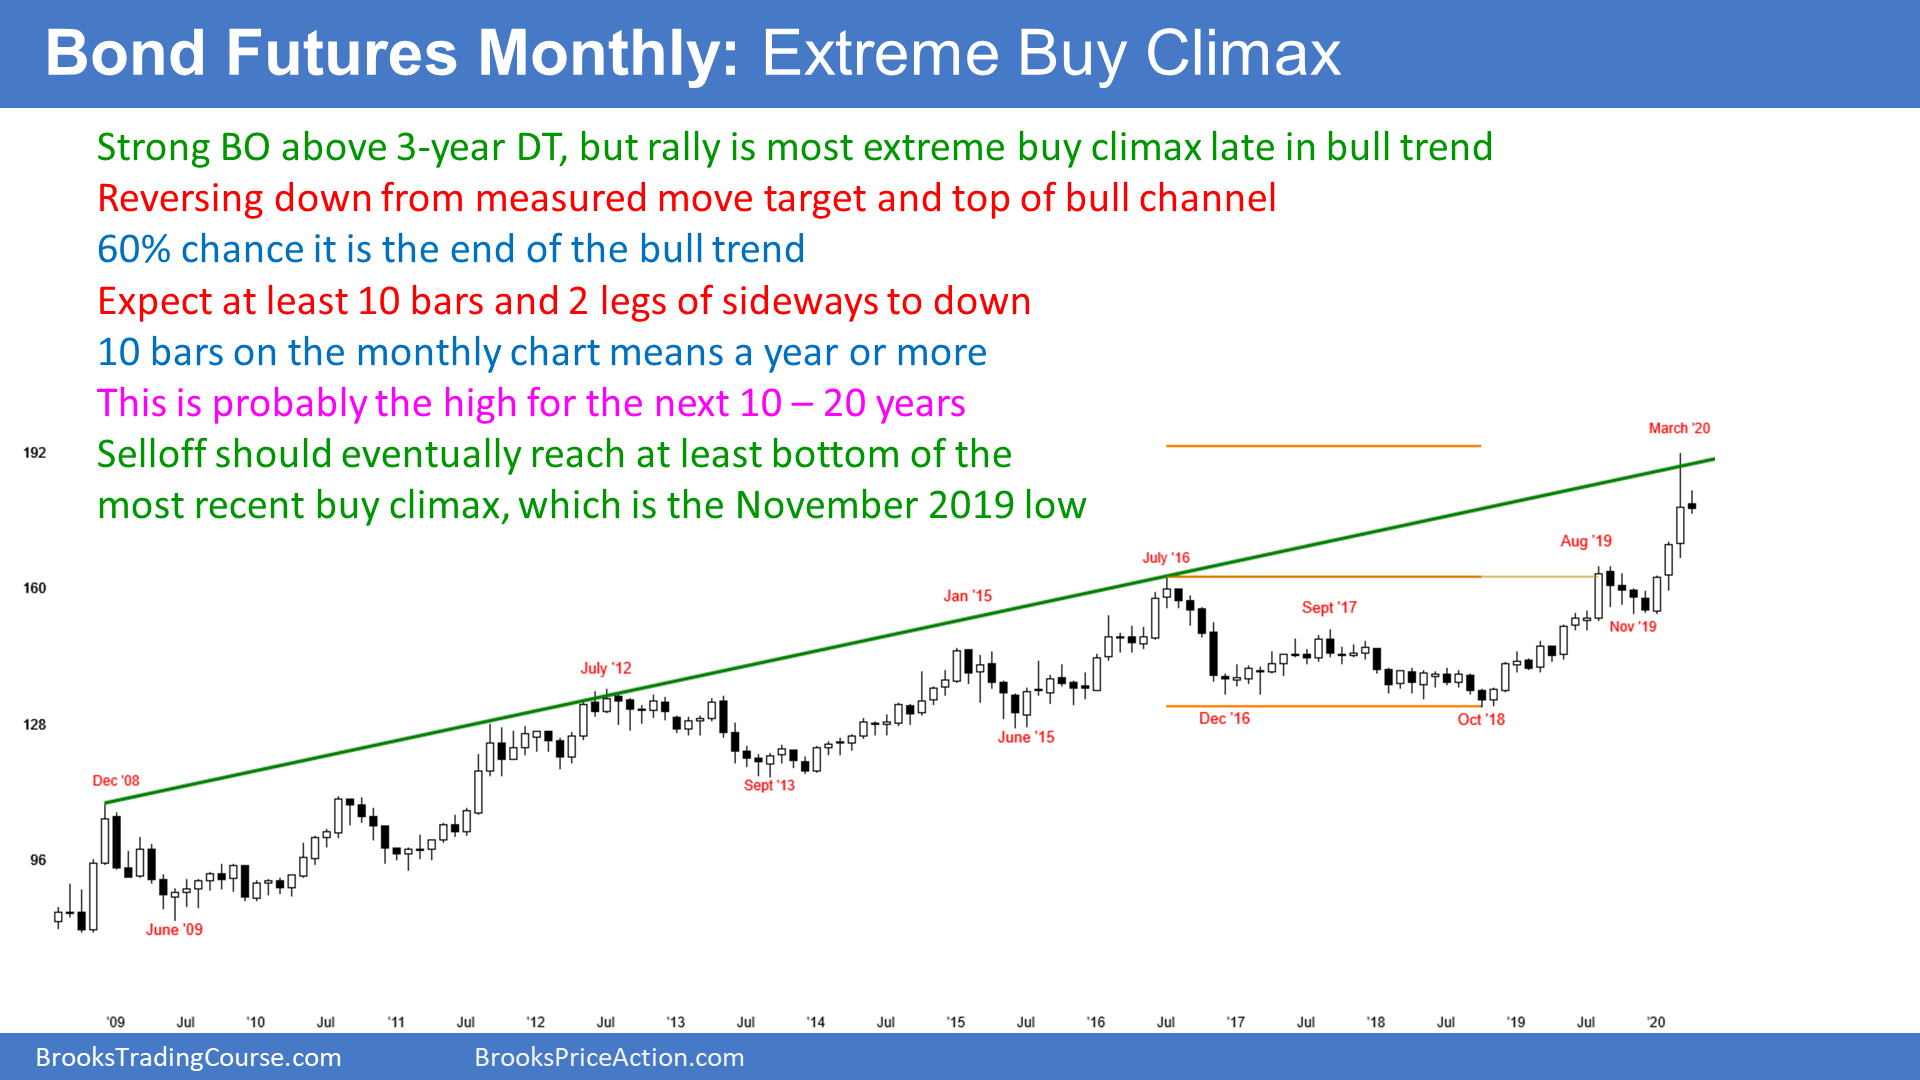
The 30 year Treasury bond futures so far this month is forming a small bar in the middle of last month’s range. The 1st 3 months of this year formed the 3 biggest consecutive bull trend bars in the entire bull trend. When the strongest breakout comes late in a bull trend, there is a 60% chance that it is at least a temporary end of the trend.
This buy climax reversed down from a measured move based on a 4 year trading range. It also reversed down from a failed breakout above top of the bull channel.
This is an example of a blow-off top. That is an extreme buy climax late in a bull trend at significant resistance. It typically will attract profit taking. Bears will also sell. The result will probably be at least a pause in the bull trend. More likely, it will lead to a protracted trading range and eventually a bear trend.
When a trend ends, it sometimes reverses into an opposite trend. But more often, it transitions into a trading range. The range typically has at least a couple legs sideways to down and lasts at least about 10 bars. Since this is a monthly chart, that is about a year.
After that, the chart would be in Breakout Mode. Theoretically, there would be an equal chance of a bull or bear breakout. If there is a bull breakout, the trading range would probably be the Final Bull Flag. That means the breakout would likely fail. Traders would expect a reversal into a bear trend that could last a decade.
What happens if there is a bear breakout?
If instead there is a bear breakout below the upcoming trading range, there is a 50% chance that it would lead to a bear trend. There is also a 50% chance that it would reverse up and just increase the height of the trading range.
The first reversal down from a climactic reversal usually retraces to the bottom of the most recent buy climax. That is the January low at around 154.
However, trends in the bond market typically last for 2 – 3 decades. Consequently, the bond market will probably work lower for at least 10 years. This is true even though it has not yet begun to trend down. The transition from a bull trend to a bear trend can take many years.
EUR/USD Weekly Forex chart:
Reversing up from bottom of expanding triangle
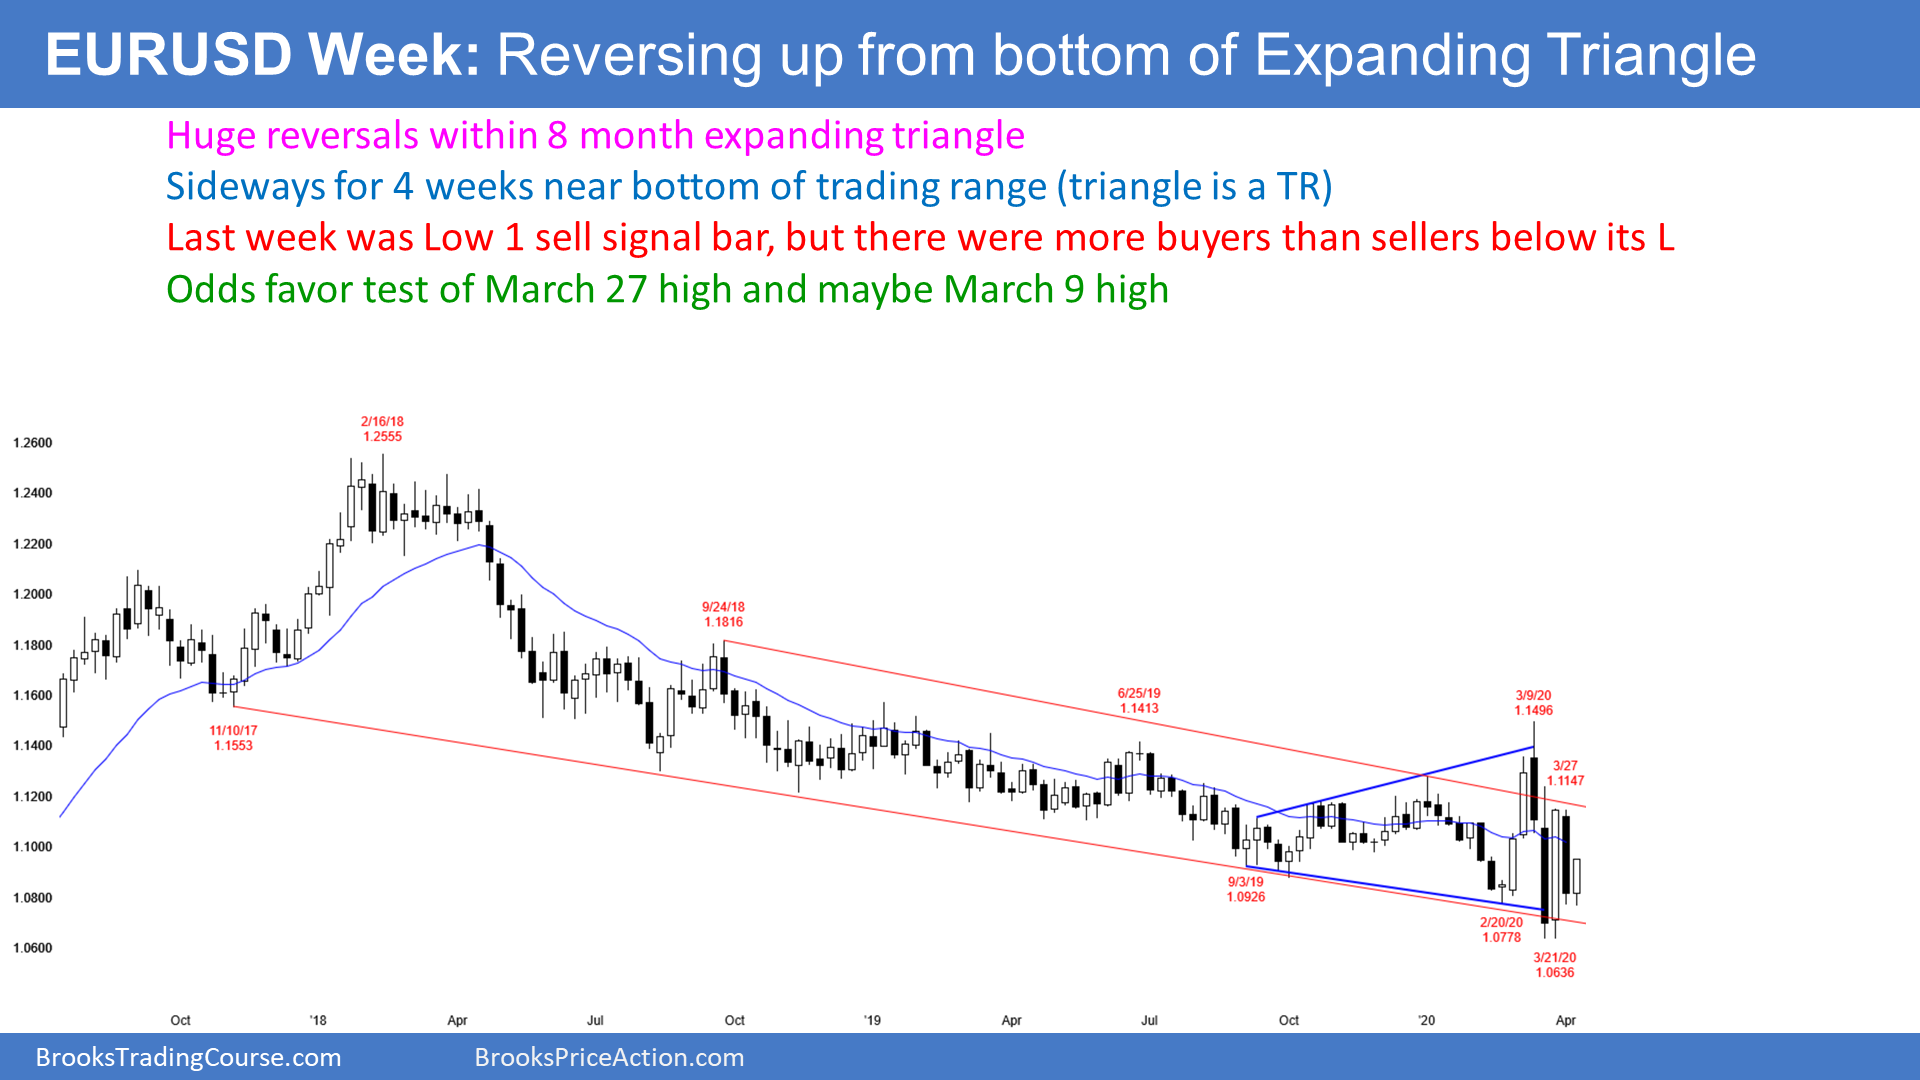
The EUR/USD weekly Forex chart has had exceptionally big reversals for a couple of months. That increases the chance of a breakout up or down. When a chart is in Breakout Mode, there is a 50% chance of either a bull or bear breakout. The chart would not be going sideways for 8 months if either side was clearly in control.
A Breakout Mode pattern also has a 50% chance of the 1st breakout attempt failing. March had both a failed bull breakout and a failed bear breakout.
Last week was a Low 1 sell signal bar. This week triggered the sell signal by trading below last week’s low. But there were more buyers than sellers below the sell signal bar. This week is now a buy signal bar for next week.
The EUR/USD is near the bottom of the 8 month trading range. It reversed up again this week after strongly reversing up 2 weeks ago. This increases the chance of higher prices next week. The targets above are the March 27 high and maybe even the March 9 high.
Monthly S&P 500 Emini futures chart:
1 – 3 month bounce from Bear Surprise Breakout
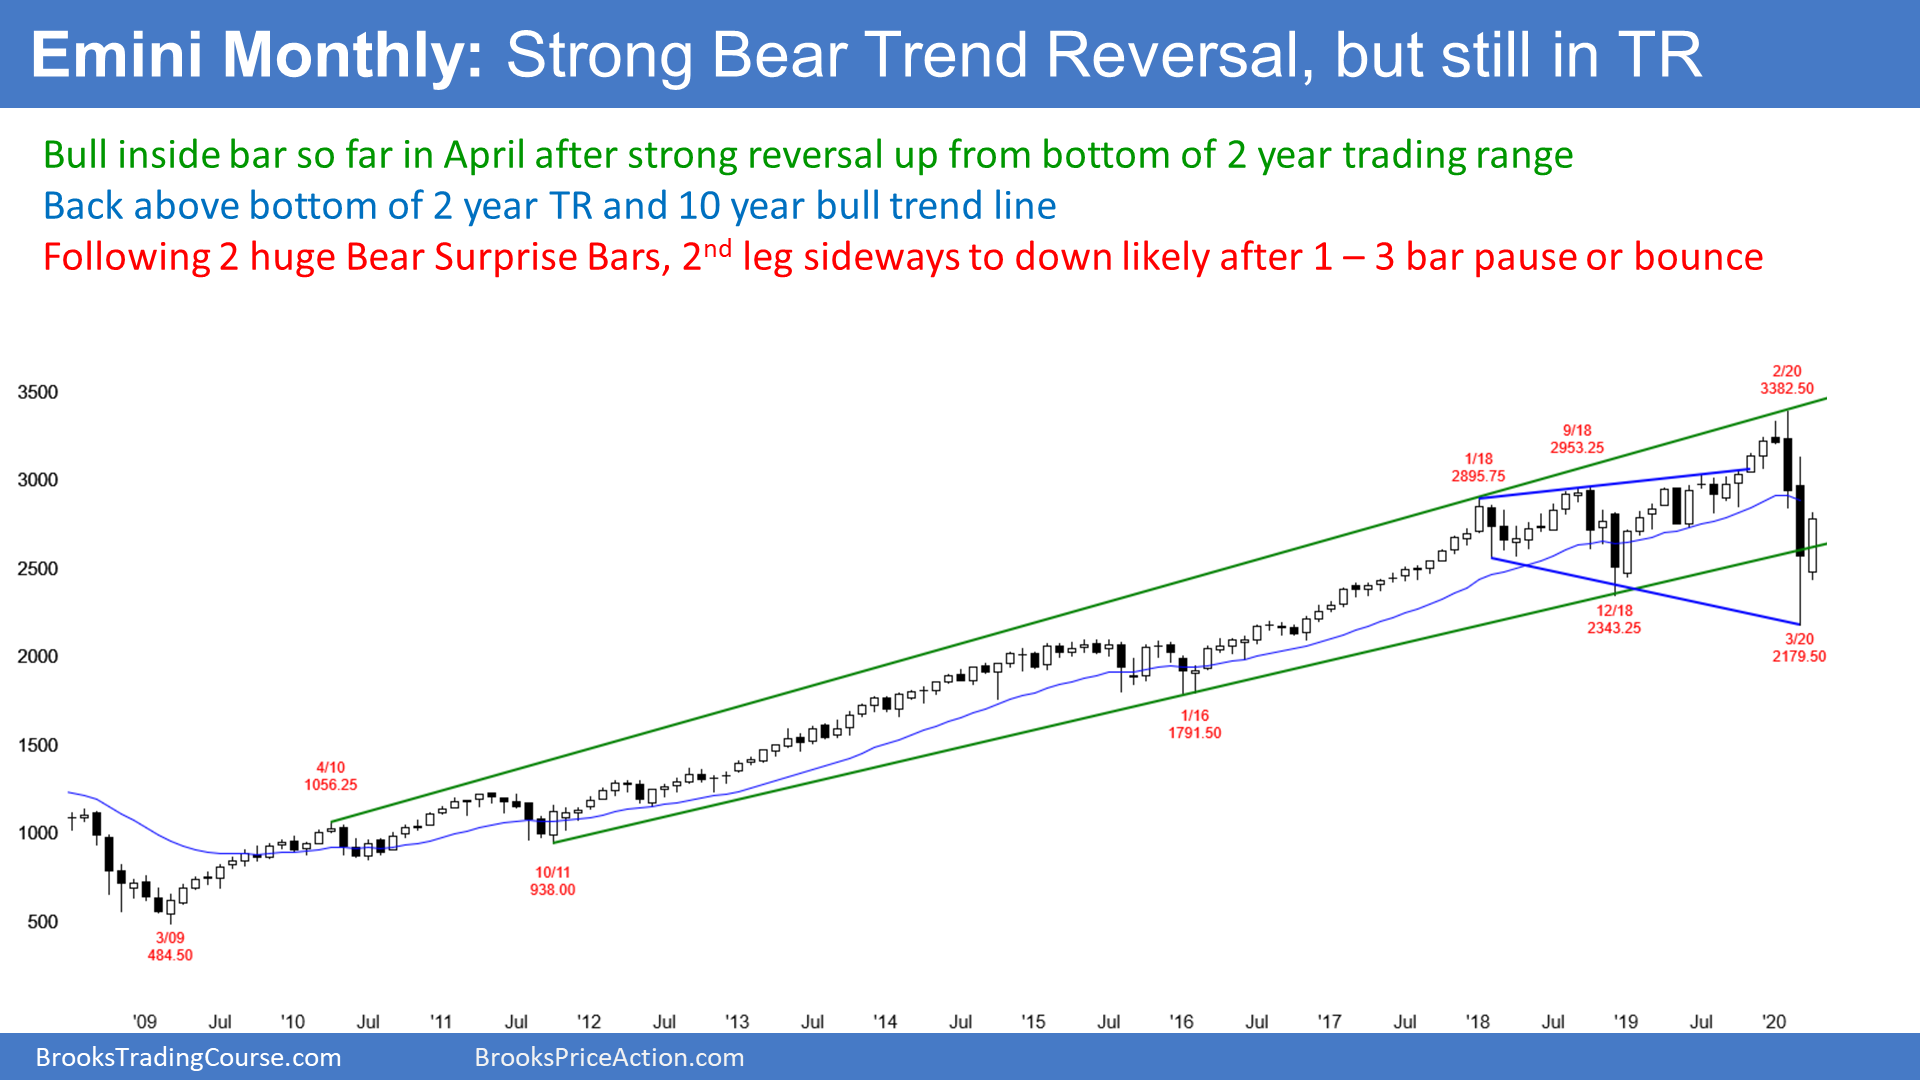
The monthly S&P 500 Emini futures chart has been sideways for more than 2 years. February and March formed a pair of surprisingly big bear bars and began a bear trend reversal. A bear surprise typically has at least a small 2nd leg sideways to down.
But the bounce sometimes will erase much of the selloff before the 2nd leg begins. Rarely, the rally will go to a new high before there is a 2nd leg down.
At the moment, there is a 70% chance that this reversal up will fail within 3 months. Traders should then expect a test down to around the 2018 or 2020 lows.
The bulls are hoping that the bull trend is resuming
The bulls have good reasons to be hopeful. The monthly chart is still in a trading range. Every bear trend since the Great Depression ended at a monthly bull trend line. This selloff reversed up strongly from below a 10 year bull trend line.
It also reversed up from below the bottom of a 2 year trading range. That trading range is an expanding triangle. A triangle in a bull trend is a bull flag. That means a bull breakout is usually more likely. If this month remains a bull inside bar closing near its high, it would be a buy signal bar for next month.
While all of these factors are good for the bulls, the bear Surprise Breakout is more important. It was extremely big and it came late in a bull trend. Also, it followed the most extreme buy climax in history (the 2017 rally). There is only a 30% chance that this rally will continue up to a new high without first having a test back down.
Trading range will probably form a major topping pattern
The 2 year trading range will probably last all year. If so, there will be at least one lower high. It would be a lower high major trend reversal sell setup. Traders will begin to talk about it as the right shoulder of a 2 year head and shoulders top. The September 2018 rally is the left shoulder.
Every trading range has both a credible buy and sell setup. However, trading ranges have inertia. They resist change. Consequently, if the bears get a reasonable lower high with a good sell signal bar, they will have only a 40% chance that the signal would lead to a bear trend.
More often, the reversal does not get far and the trading range continues. Traders then watch for the next buy or sell signal.
Lasting effect from the pandemic
I have been saying since late last year that the 2 year trading range would probably continue all year. This is still true. In fact, the stock market will probably be in a trading range from 1800 to 3600 for the next decade.
However, I keep making the point that this was due to the extreme buy climax that ended in late 2017 and not the pandemic. The pandemic simply unleashed what was already going to happen. The market was just waiting for a trigger.
But the pandemic will still be very important over the next year. It has significantly changed consumer habits. Consumer spending is responsible for 70% of the GDP. Are you going out to dinner or traveling as much as last year? How often have you been to the mall in the past 2 months? How much have you driven lately? We all are spending less.
The huge surge in unemployment is further greatly reducing the GDP. These changes will not return to normal for many months after a vaccine. Therefore, the pandemic will continue to hurt economy for at least another year.
The Fed has been amazing
As many of you know, I have been critical of Fed Chairman Powell because he appeared to be intimidated by President Trump. However, he and the Fed have done an extremely good job with this catastrophe.
The market is rallying because it was oversold and because everyone loves what the Fed has been doing. It continues to release a series of nice surprises that greatly bolster consumer confidence.
But as I have been saying, all they are doing is preventing a disastrous problem from destroying the economy. They are treating the problem, but they cannot fix it. There is a limit to how far the rally can go, given that the pandemic will keep the economy weak for at least a year.
What happens when the Fed stops doing nice things?
Part of the rally is a bet that there will be a next nice Fed surprise. At some point, the Fed will be finished. The part of the rally built on the expectation of more surprises will stop. Those traders will not only stop buying, they will begin to take profits. I doubt the Fed has enough surprises lined up to take the market back to the old high.
More importantly, the forces behind that 2017 buy climax will be with us for a decade. Therefore, even though the Fed is averting a depression, it will not be able to make the economy healthy again.
A new high would result in a very overbought P/E ratio
The price of the S&P index relative the to average earnings of the stocks in the index (P/E ratio) was 25 in early February. That is at the high end of the historical range. The average is around 19.5. Earnings will be far below normal for many months and probably the remainder of the year.
What happens if the stock market gets back to the February high this year? This time, that price would be relatively much more expensive because the earnings will be so much lower. The P/E ratio would be extremely overbought. Fewer institutions will be willing to pay that price for those earnings.
How many people want to pay a high price when the average company is not earning much? I will let someone else buy up there. I will be looking to sell.
Since late 2017, price has been too far ahead of fundamentals. It typically takes a decade for the fundamentals to catch up. The 2020’s will probably be similar to the 1970’s and the 2000’s. Traders should expect sideways price action with big rallies and selloffs for the next 10 years.
Weekly S&P500 Emini futures chart:
Reversing up from expanding triangle, but more trading range likely
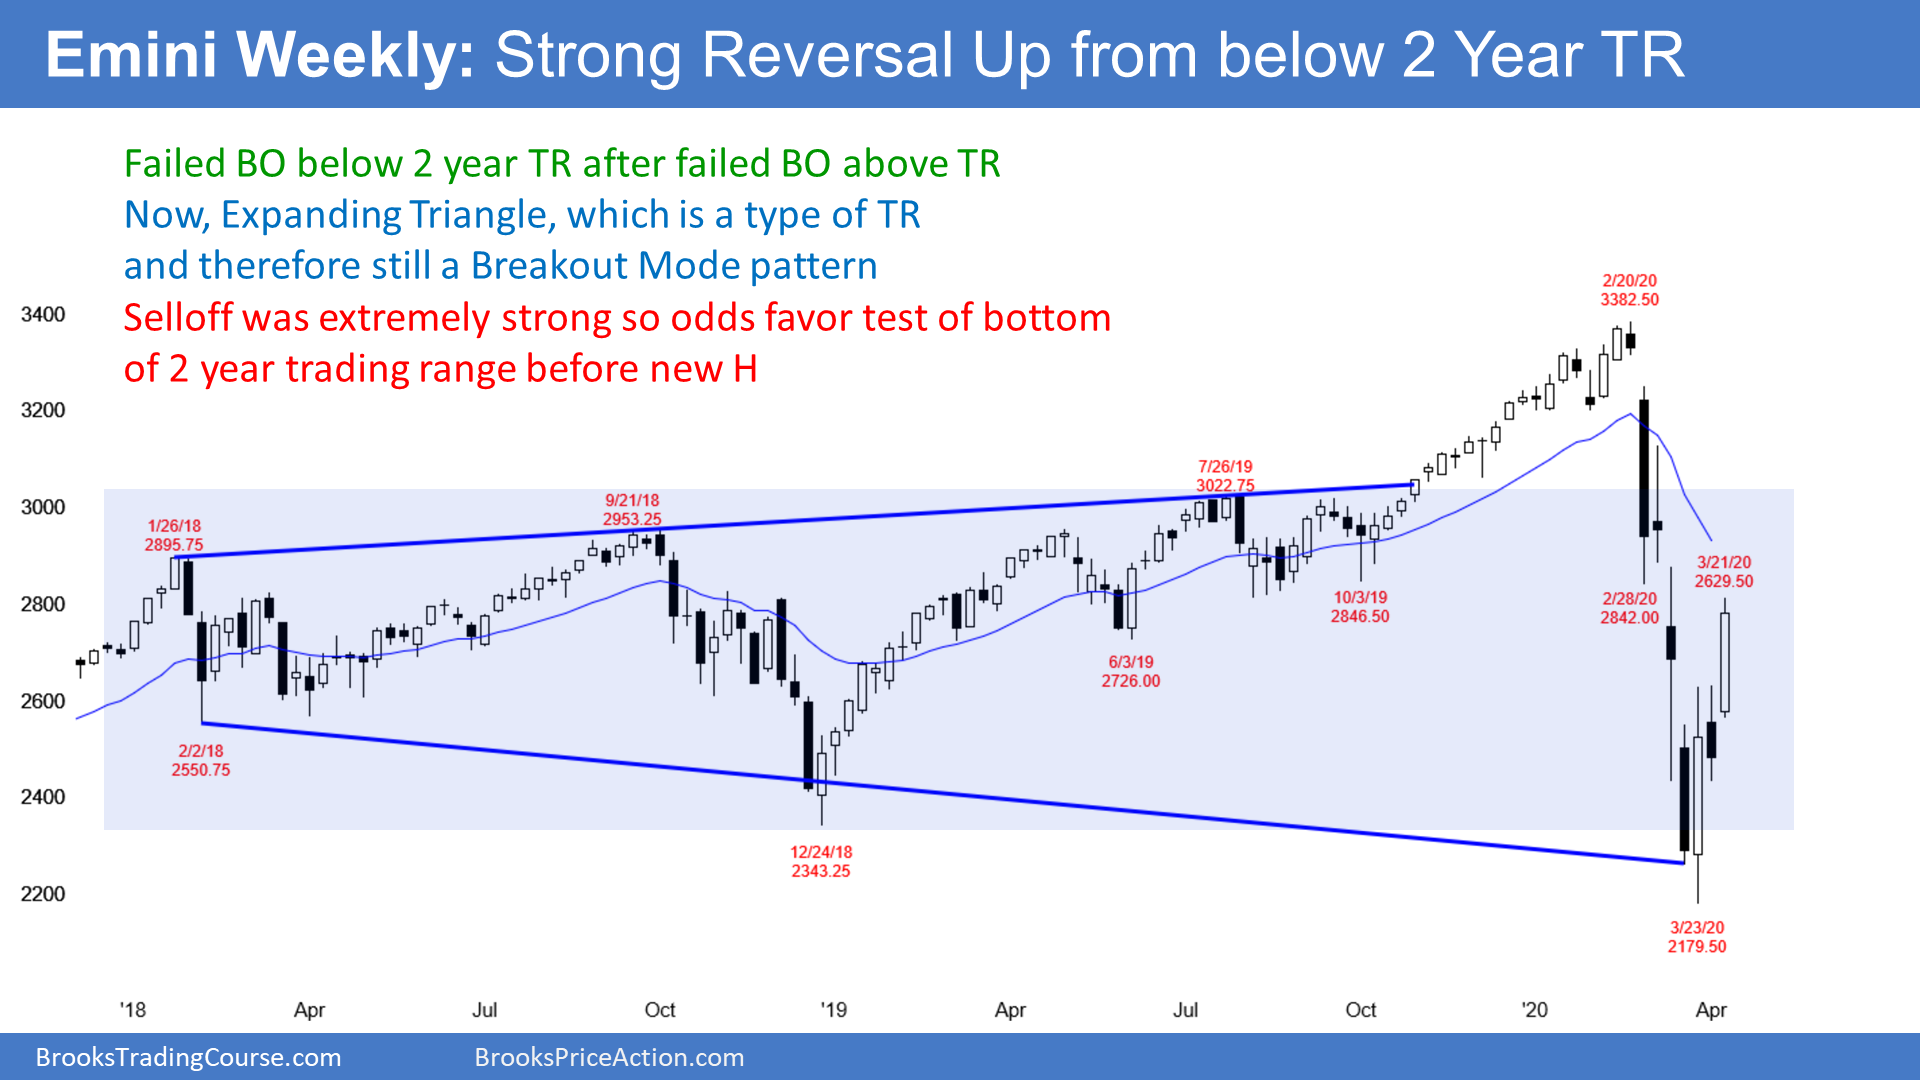
The weekly S&P500 Emini futures chart broke above the 2 year trading range in February but reversed violently down. It broke strongly below in March and is now violently reversing up. Since it is now back to the middle of the range, it is fairly neutral.
The bulls hope that this rally is the start of a reversal up from an expanding triangle bottom. Their target is a new high.
But the collapse was extremely strong. That makes it likely that this rally will not continue to the high without first entering a small trading range for several weeks.
In fact, after a 34% selloff, the bulls will probably need at least a couple years before they can reach the old high. And even then, because of how extreme the 2017 buy climax was, the Emini will probably be unable to go much above the old high for possibly the rest of the decade.
Slightly more rally likely
Last week was a big bull bar in a big 3 week rally. Traders expect at least slightly higher prices next week. The 20 week EMA is a magnet above.
But traders know that legs in trading ranges typically stall once they reach the middle third of the range. Consequently, they expect at least a few sideways weeks to begin within the next couple of weeks.
After that, at test down to the bottom of the range around the December 2018 low or the March low is more likely than a continuation up to the prior all-time high.
Daily S&P500 Emini futures chart:
Emini wedge rally to 50 percent retracement of coronavirus crash
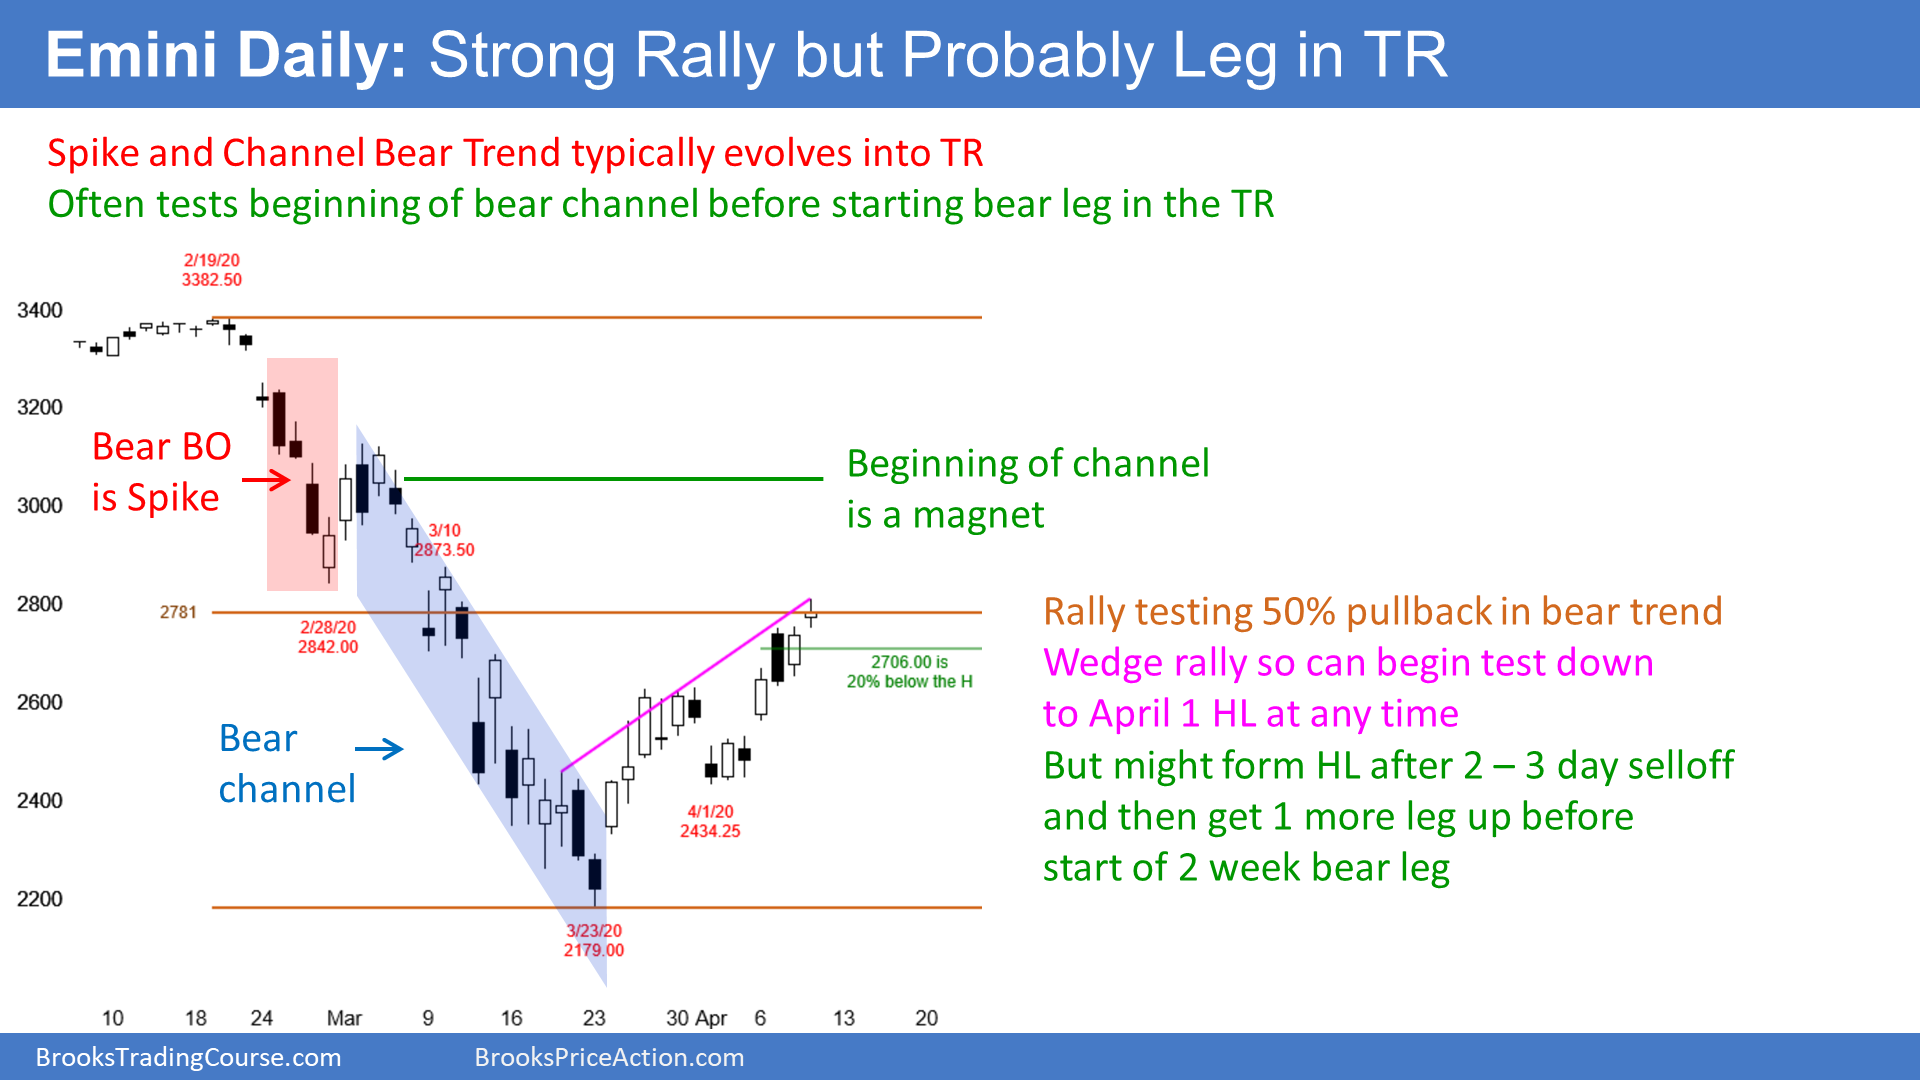
The daily S&P500 Emini futures chart has rallied strongly for 3 weeks. By going above 2706, it is no longer 20% below the high. Consequently, it is no longer in a bear market.
Furthermore, it is now more than 20% above the low. Many traders therefore believe the Emini is back in a bull market.
But Big Down, Big Up, creates Big Confusion. Confusion is one of the hallmarks of a trading range. Traders should expect a bear leg in the developing trading range to begin soon.
This week went above the 50% retracement level of the 2 month bear trend. The bulls hope that the V bottom reversal continues up to the March 3 high. That was the start of the parabolic bear channel. But given how far above the low that is, there will probably be a 2 week pullback first.
While there is not a clear wedge yet, the rally is beginning to develop wedge characteristics. That is an early sign that the bulls are getting hesitant and the bears are starting to short.
Spike and Channel Bear Trend usually evolves into trading range
Traders know that a reversal up from a Spike and Channel Bear Trend usually eventually tests the start of the bear channel. Then, the rally typically evolves into a trading range.
That target is probably too far to reach with this V bottom, given how strong the selloff was. Therefore, traders should expect a test down to the April 1 higher low or March 23 bear trend low first. At that point, the bulls will try again.
There is no top yet so the rally might continue for another week or two. However, the bulls will probably start taking profits and the bears will begin to sell now that the rally has retraced half of the bear trend.
How far up will the V bottom rally go?
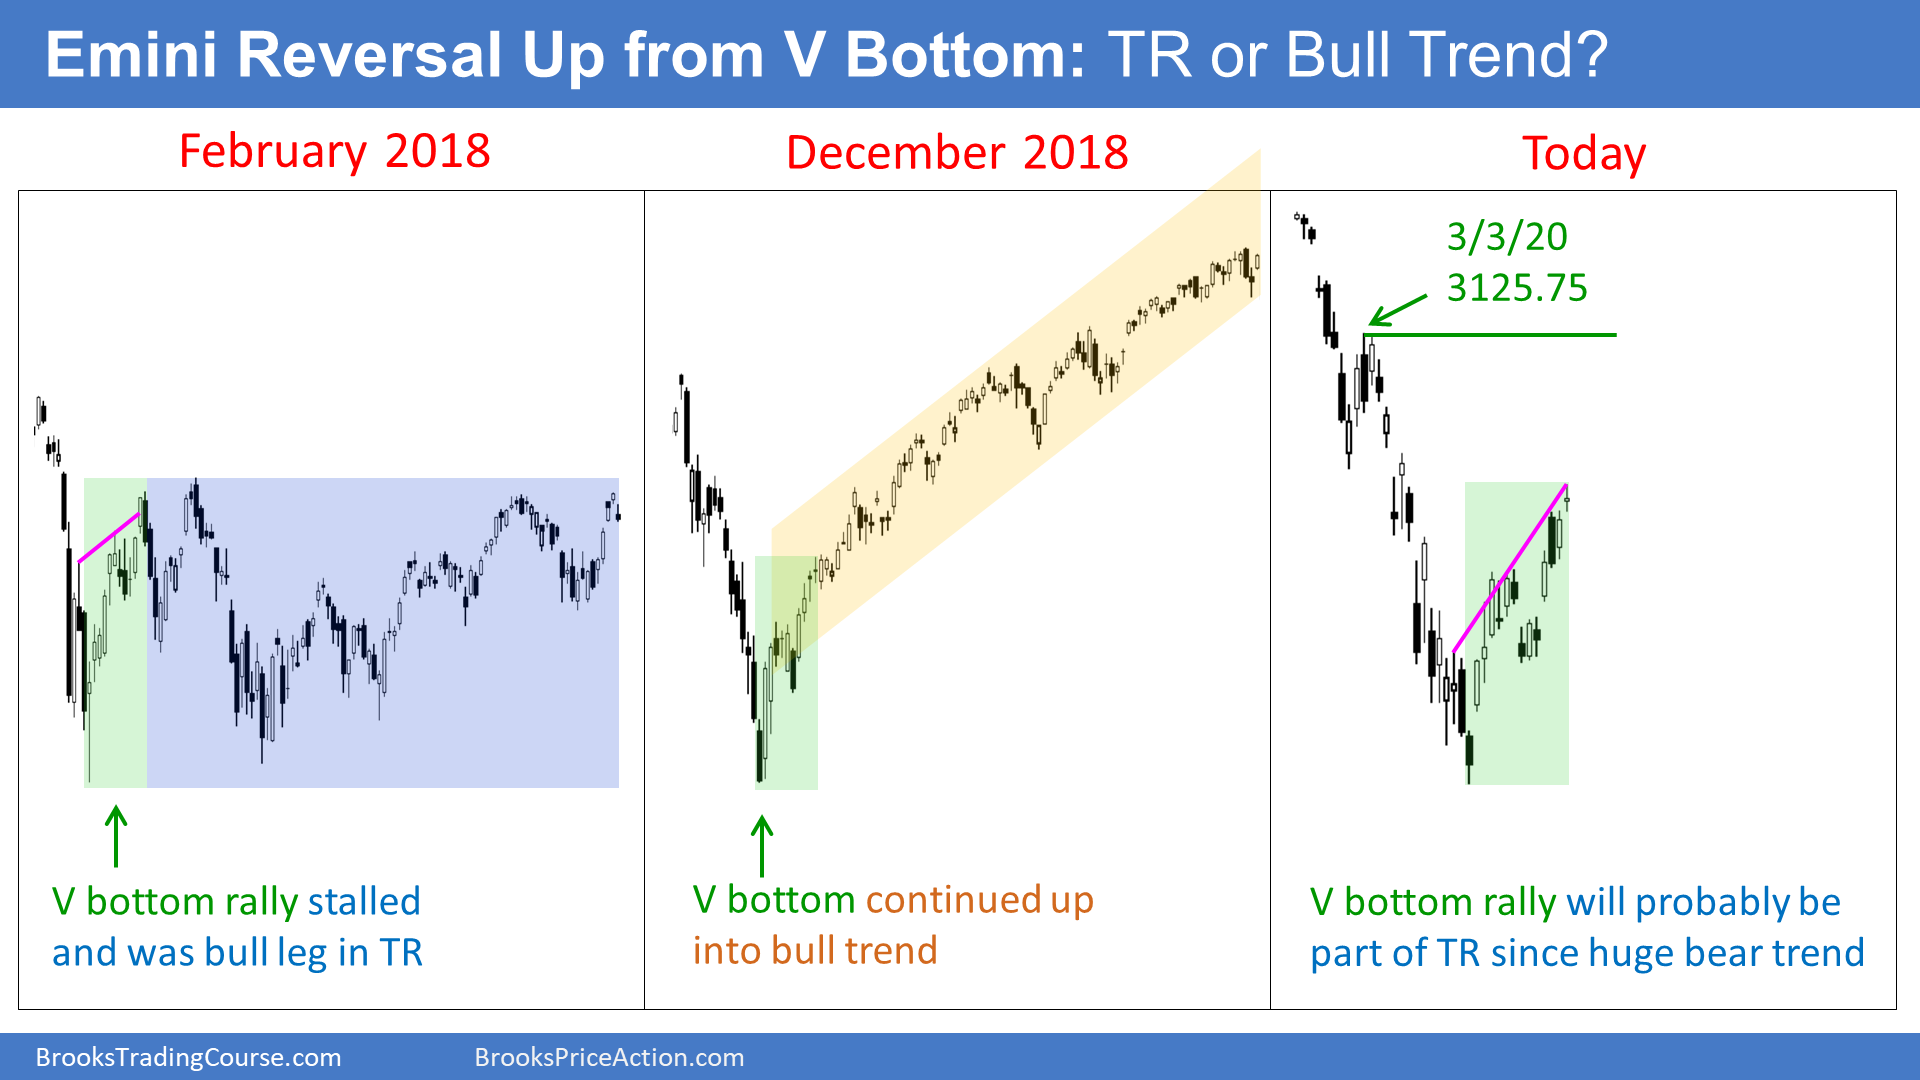
There have been 3 strong selloffs over the past 26 months. In February 2018, there was a 10% selloff and then a strong rally. It was a wedge rally and it became a bull leg in what grew into a 6 month trading range.
The 20% collapse at the end of 2018 also led to a V bottom reversal. The rally grew into a bull trend. It lasted the entire year and the Emini made a new high.
What will happen this time? The rally has been strong, like the other 2 times. Also, the start of the parabolic wedge bear channel was the March 3 high. That is a magnet after a sell climax. Many bulls expect the rally to get there before there is more than a 3 day pullback.
But the stock market collapsed 34% in a short time. That is the most dramatic bear market since the 1929 Crash. Traders know that this is enough to make a V bottom reversal unlikely to grow into a bull trend. The bulls currently have only a 30% chance of a new high within the next 2 years.
Trading range more likely than bull trend
At the moment, there is a 70% chance of a test of the March low or the April 1 higher low before there is a new high. But when will that test down begin? There is a developing wedge shape to the rally. That often leads to a couple legs down. Traders still want a clearer top, especially since the 3 week bull channel is tight. This is a strong rally.
The parabolic bear channel began with the March 3 lower high. Traders know that a rally up from a Spike and Channel Bear Trend usually reaches to around the beginning of the bear channel. Even if it does, it will probably test down first.
Late in the March collapse, I said several times that there would be an extremely strong rally. It would be the start a V bottom reversal. But I said V bottoms reverse into bull trends only 20% of the time. They do so less often after crashes.
That is why I wrote that the V bottom rally would fail after a couple months and end up as a bull leg in what would become a trading range. This is similar to what happened in February 2018.
The 3 week rally is behaving the way I thought it would. I still expect the reversal up from the V bottom to fail. Traders should expect the Emini to enter a trading range, probably for the rest of the year. However, there is no top yet. The Emini will probably be sideways to up for at least another week or two.
