Monthly S&P 500 Futures candlestick chart:
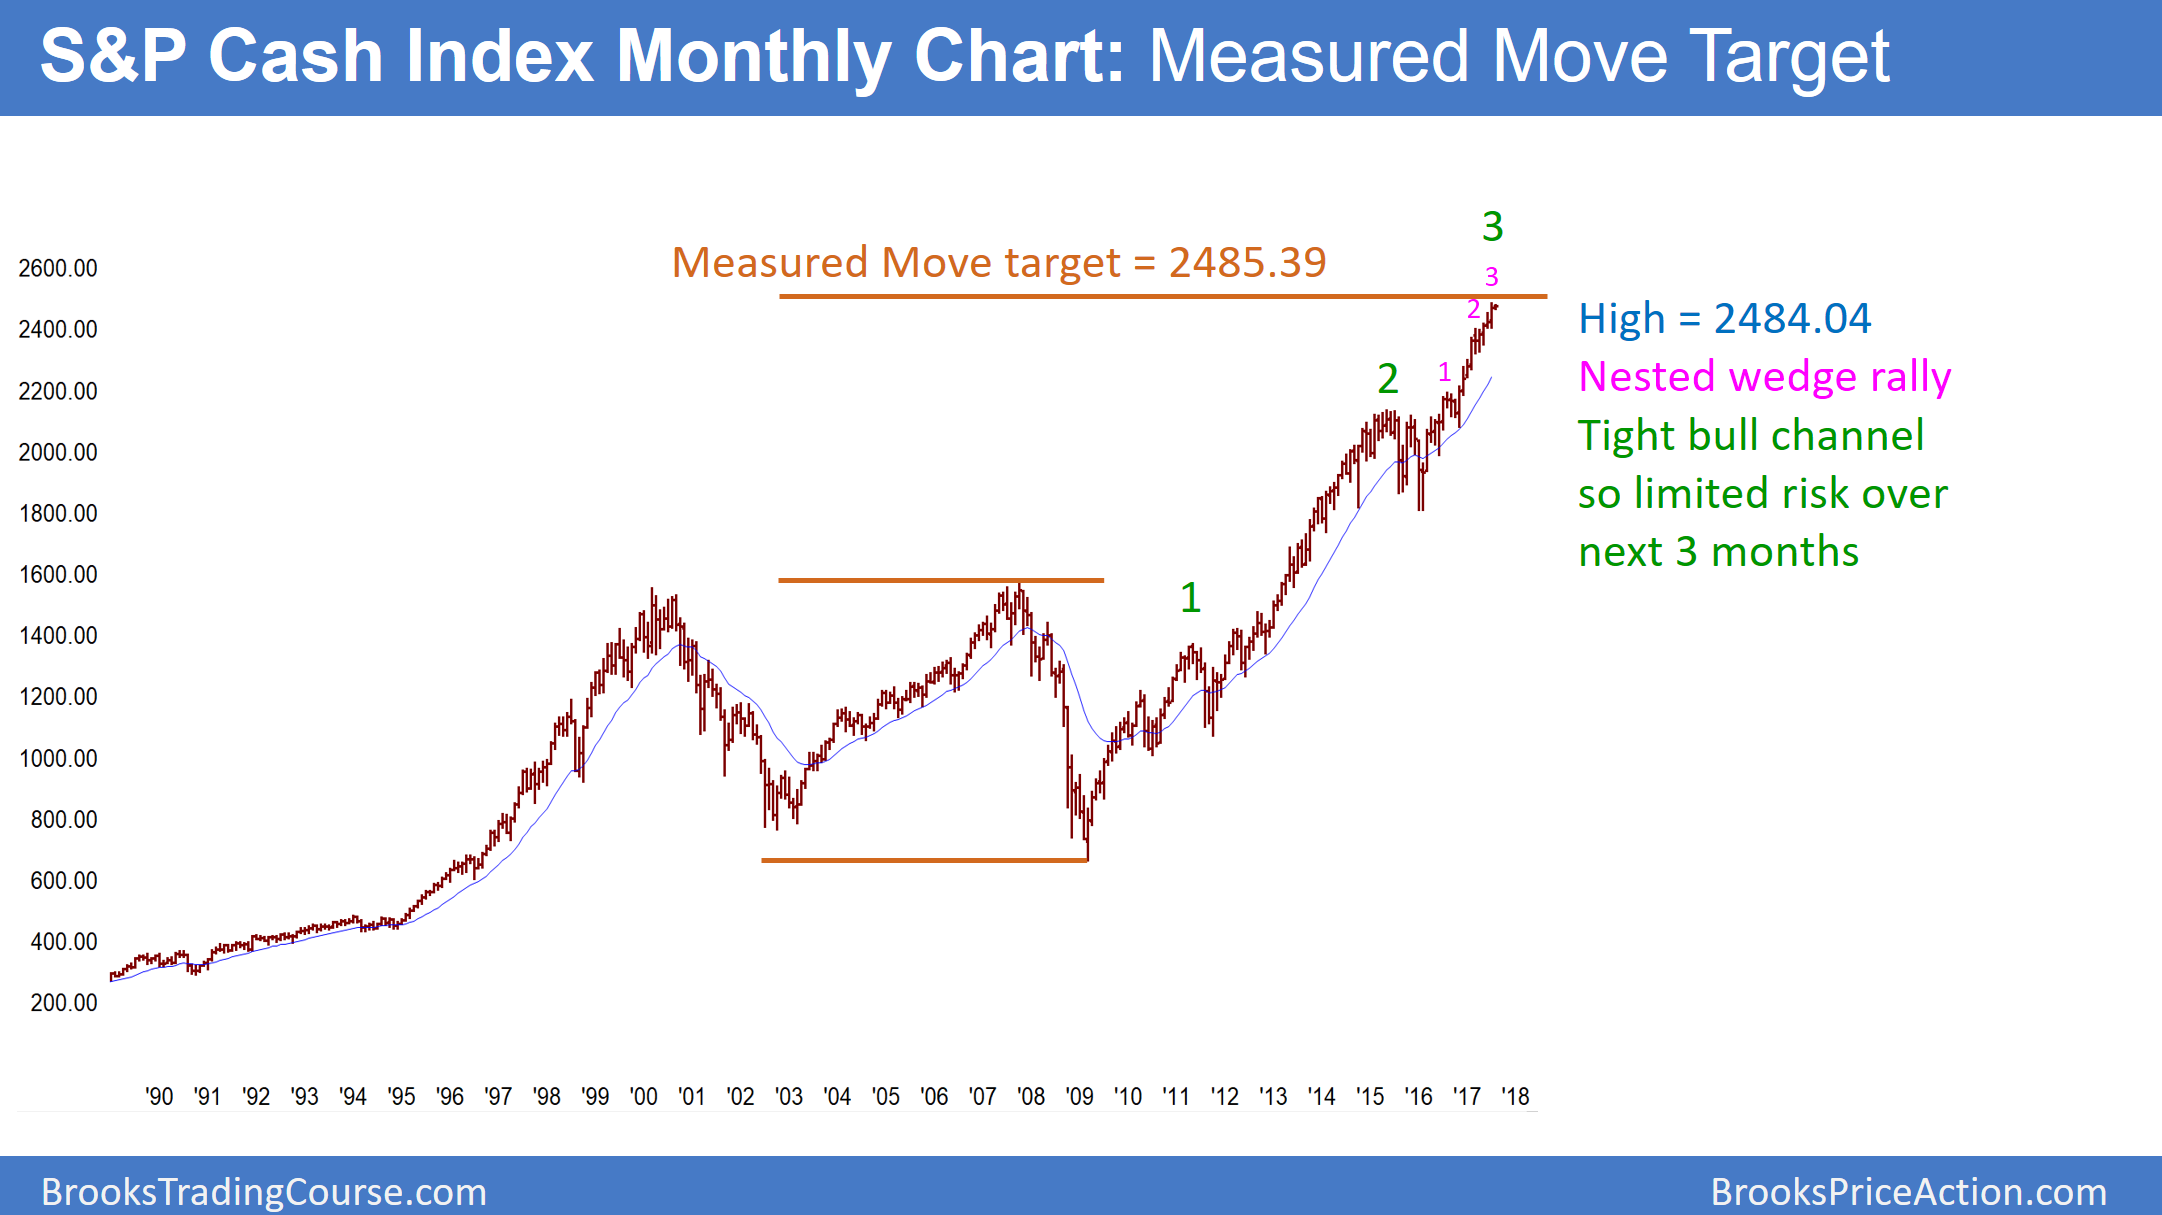
9 bar micro channel

The monthly S&P500 cash index is at a measured move up from the 2002 and 2009 double bottom. Every bar for the past 9 bars on the monthly chart has a low at or above the low of the prior month (cannot see on this bar chart). This is a 9 bar bull micro channel. In addition, it is the 3rd push up in an 18 bar parabolic wedge rally (see last week’s chart). Finally, the monthly chart has been in a strong bull trend for about 90 months.
The monthly S&P500 Emini futures candlestick chart is in a strong bull trend. In fact, the 18 month rally is in a tight bull channel where there has not been a pullback for 9 months. This is therefore a 9 month bull micro channel, which is a sign of strong bulls.
Buy climax with Emini risk from low volatility, algorithms, and central banks
When exceptional strength occurs late in a trend, it is usually climactic. A buy climax does not mean that there will be a reversal into a bear trend. However, the stop for the bulls gets further away. Since that increases risk, the bulls need to reduce their risk. The easiest way is to take some profits. Consequently, that is what is likely to happen soon.
The bulls have been so eager to buy that they have not waited for a bar to fall below the low of the prior month. They will probably get that opportunity in the next few months, and will likely buy the 1st 1 – 3 month pullback.
However, once the rally resumes, traders will pay attention to what the Emini does once it gets back to the high. If it reverses, that will create a micro double top, which could lead to a bigger pullback. Yet, since the 18 month rally is in a tight bull channel, the first bigger reversal down will still probably be minor. That means that a trading range or a bull flag is more likely than a reversal into a bear trend.
Risk of surprisingly big reversal?
Traders are aware that the volatility has been unusually low. This means the puts are cheap. If institutions need to lower the price of puts to be able to sell them, then traders do not think there is much risk. In addition, those option selling institutions will do whatever they can to make those puts expire worthless. One way to do this is to keep buying stock. If enough do it, the Emini will not fall and the puts will expire worthless.
This is one of the reason why the market usually gives traders a lot of time to sell a top. This is the exact opposite of the incorrect adage, “The market never gives traders a lot of time to sell a top.” Most tops come from trading ranges, which means there is usually a lot of opportunity to sell.
Many central banks will make interest rate decisions in September. This could be a catalyst for a reversal down.
Risk from computer algorithms
Most trading is done by computers. They pay attention to volatility. When it is low, they have to increase their risk to maintain their returns. This added leverage creates the potential for an unexpectedly sharp reversal in a strong bull trend. Once the market begins to turn, usually on some news item, it can accelerate down as all of the leveraged firms have to quickly reduce their leverage. They do so by selling, and their selling causes other firms to reduce leverage.
Also, option selling firms suddenly hold losing positions. They then have to sell stock to offset their losses from their short puts. That further accelerates the selling. Therefore there is always a risk of a big, fast reversal when there is a strong bull trend. However, the risk is small. Bulls have been so eager to buy that they will probably aggressively buy a 5 – 10% correction.
Weekly S&P500 Emini futures candlestick chart:
Extreme buy climax

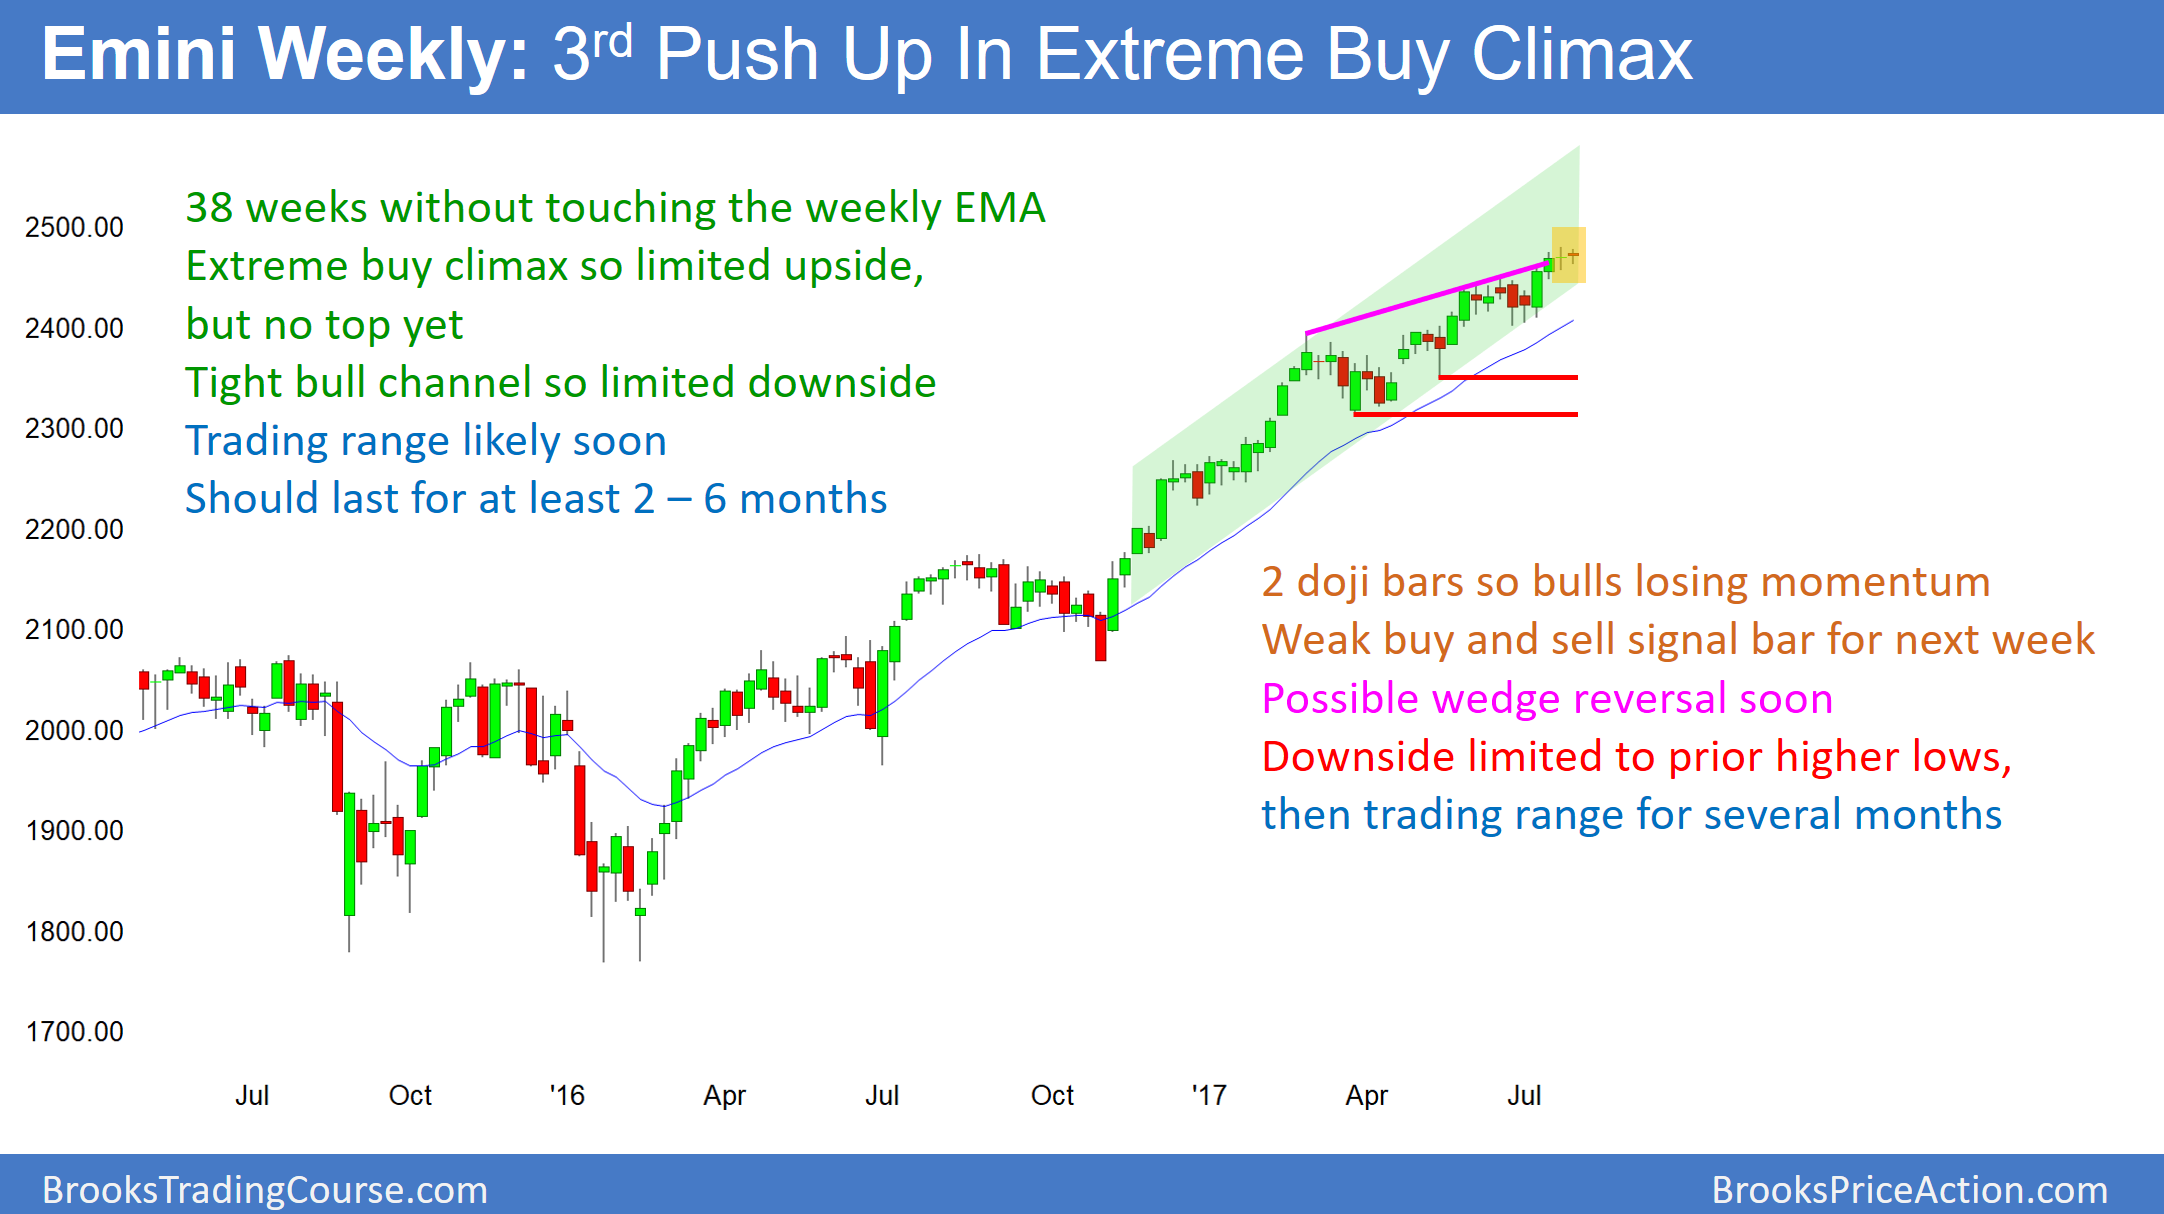
The weekly S&P500 Emini futures candlestick chart has not touched is 20 week exponential moving average in 38 weeks. Therefore, the Emini is the most overbought that it has ever been in its 18 year history. The past 2 weeks were small doji bars. While this past week is not a strong buy or sell signal bar, it does represent a loss of momentum.
The weekly S&P500 Emini futures candlestick chart is in a strong bull trend. Yet, it is too strong. The Emini has never been this far above its average price for this long in its 18 year history. While there is no top and no reversal down yet, the odds are that it will fall 20 – 50 points below its average within the next few months. Reasonable targets are the May and March lows, which would be about a 150 point pullback from the high.
Since this month is an inside bar in a bull trend, it is a High 1 bull flag. Yet, it is a weak buy signal bar in an overbought bull trend. It is also a sell signal bar for a failed breakout above the June high. Again, a doji bar is neutral and therefore a lower probability signal bar.
Because the channel up from the November low is so tight, the 1st reversal down will probably be minor. This means that the best that the bears probably can get is a trading range. If the selloff were to fall 150 points, the Emini might take 2 – 3 months to get there. The bulls will probably buy the pullback. However, after a 150 point pullback, if one comes, the bears will probably sell the 1st rally. The result would be that the trading range could last for 3 – 6 months.
Daily S&P500 Emini futures candlestick chart:
Broad bull channel

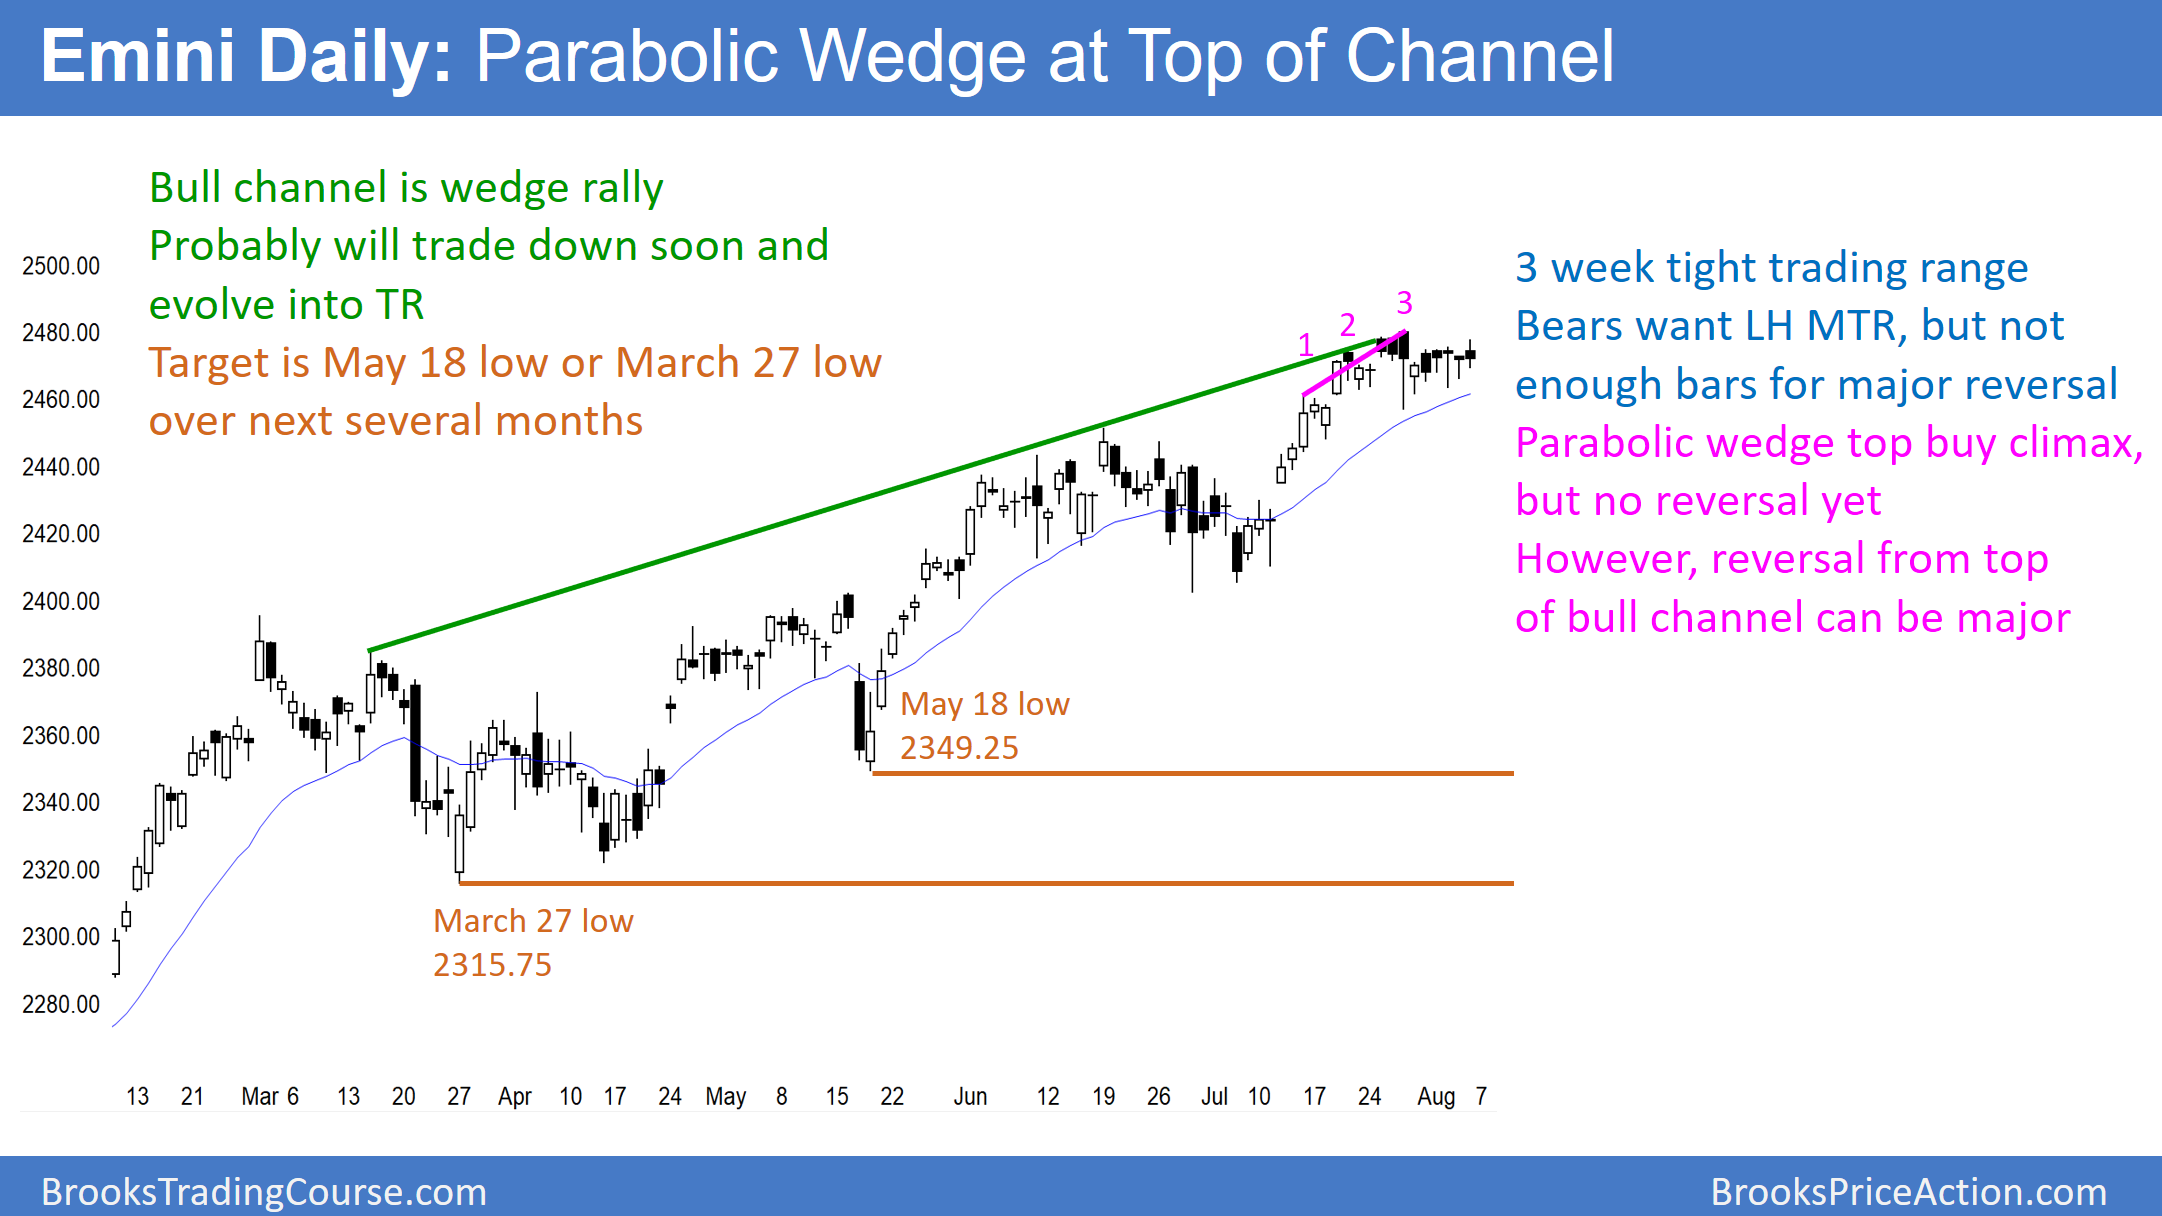
The daily S&P500 Emini futures candlestick chart has been in a broad bull channel since March. There is no reversal yet.
The daily S&P500 Emini futures candlestick chart has been in a broad bull channel for 6 months. There is a 75% chance that there will be a bear breakout below the bull trend line. This can come from the Emini going sideways or down. This means that a bull channel behaves like a bear flag.
From the market cycle, traders know that the market typically has a breakout, like in February. It then pulls back. Once the rally resumes, it usually is in a channel, like the current one that began in March. The channel typically evolves into a trading range, which should happen soon. Once it is in a trading range, there are both buy and sell setups. The market would therefore then be in breakout mode. Consequently, the breakout from the range can be up or down.
Downside target
Traders should expect an eventual break below the bull trend line, and then a selloff to the beginning of the channel. That is the March low. At that point, the bulls buy again and the bears take profits. As a result, there is usually a rally. If all of this unfolds, traders would then conclude that the daily chart had entered a trading range. Since the rally took several months, the test down to the March low will probably take several months as well.
It is important to remember that there is no top yet. Consequently, the rally could continue much higher before there is a swing down to the March start of the channel. Yet, because the weekly chart is so overbought, the odds are that the rally will not last much longer.
