
Emini Daily Chart
– Another day, another new high. An Emini relentless rally.
– Tight bull channel for two weeks after strong reversal up from July 19 low. No sign of top. Traders continue to expect higher prices. They will buy one- to three-day pullback.
– Getting near top of bull channel based on the May 7 and July 14 highs, which is about 10 points above yesterday’s high. If bulls get breakout above it, the Emini will probably start to reverse back down within about five days. Most breakouts above bull channels fail before getting very far.
Emini 5-Minute Chart And What To Expect Today
– Emini is up 5 points in the overnight Globex session.
– If today gaps up, the gap will be small. Small gaps typically close in the first hour.
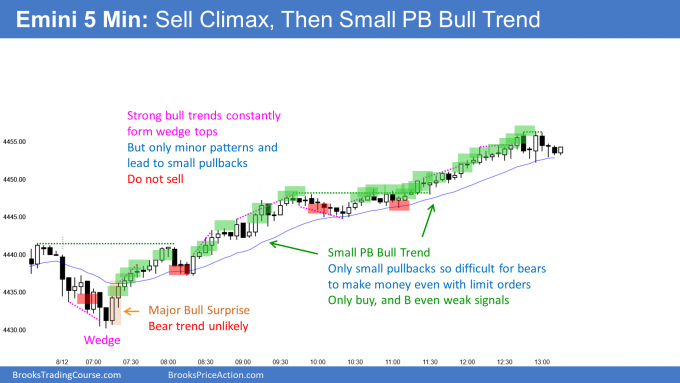
– Yesterday was a buy climax. There is, therefore, a 75% chance of at least a couple hours of sideways to down trading today that begins by the end of the second hour. There is a 50% chance of follow-through buying in the first hour.
– Today is Friday, so weekly support and resistance can be important, especially in the final hour.
– The bulls want a bull body and for the week to close near the high. That would increase the chance of higher prices next week.
– A close near the high of the week would also increase the chance of a gap up next week on the weekly chart.
– The bears want the week to close below the open of the week. That would increase the chance that next week will trade below this week’s low. However, today would have to completely reverse yesterday’s strong rally, and that is unlikely.
Yesterday’s Emini setups
Here are several reasonable stop entry setups from yesterday. I show each buy entry with a green rectangle and each sell entry with a red rectangle. Buyers of both the Brooks Trading Course and Encyclopedia of Chart Patterns have access to a much more detailed explanation of the swing trades for each day (see Online Course/BTC Daily Setups).
My goal with these charts is to present an Always In perspective. If a trader was trying to be Always In or nearly Always In a position all day, and he was not currently in the market, these entries would be logical times for him to enter. These therefore are swing entries.
It is important to understand that most swing setups do not lead to swing trades. As soon as traders are disappointed, many exit. Those who exit prefer to get out with a small profit (scalp), but often have to exit with a small loss.
If the risk is too big for your account, you should wait for trades with less risk or trade an alternative market like the Micro Emini.