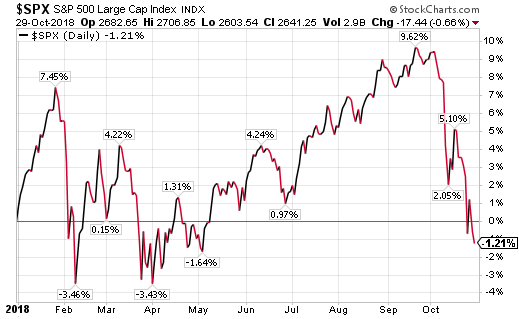
For a period of time this year, the U.S. equity market avoided the weakness that was occurring in many other equity markets around the world. October has certainly changed this though. As can be seen below, the S&P 500 Index is in correction territory now, i.e., down greater than 10% from its high at the end of September.
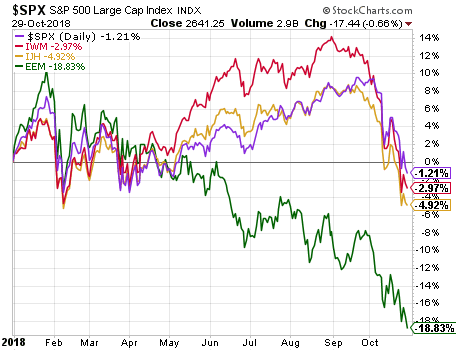
Faring worse than the U.S. equity market are markets outside the U.S, especially the emerging markets. In 2017 the MSCI Emerging Markets Index was one of the top performing asset classes returning 37.8%. This year though, emerging markets have been one of the worst performing asset classes. The below chart shows the iShares Emerging Markets Index ETF (NYSE:EEM) decline totaling in excess of 18%. Combining the strong return from 2017 with the 2018 YTD return the iShares Emerging Markets ETF has generated a low double digit return.
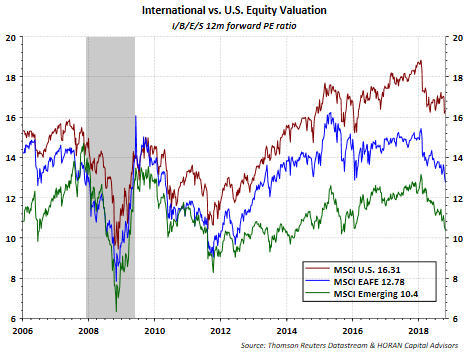
The decline in emerging market returns has led to the MSCI Emerging Index valuation trading near a single digit P/E as noted by the green line in the below chart.
In part, higher interest rates in the U.S. have contributed to some of the instability in some emerging market countries as the higher interest rates have led to a strengthening of the U.S. dollar. One consequence of a stronger dollar for emerging market countries is the increase in the cost of dollar denominated purchases and/or repayment of dollar denominated debt.
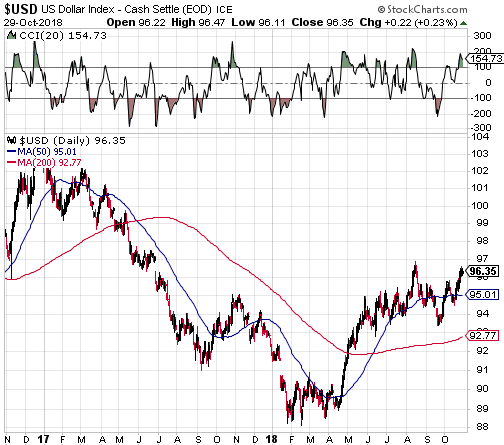
Dollar strength persisted in the first half of the second quarter then began to weaken as the quarter came to an end. As October has unfolded though, the dollar has resumed its strengthening path as seen in the above chart.
A combination of dollar stability and lower emerging market currency volatility would likely be beneficial to emerging market equities. The 'Large Speculators' future positions in the US Dollar could be viewed as crowded on the long side as seen in the below chart. It is worth watching the US dollar positioning to see if large speculators begin to reduce their long positions; thus, leading to some US dollar weakness ahead. 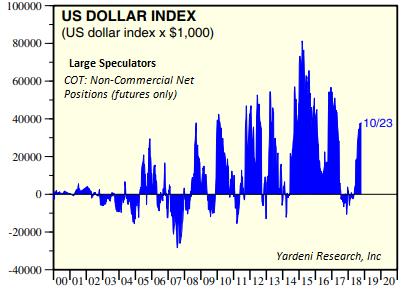
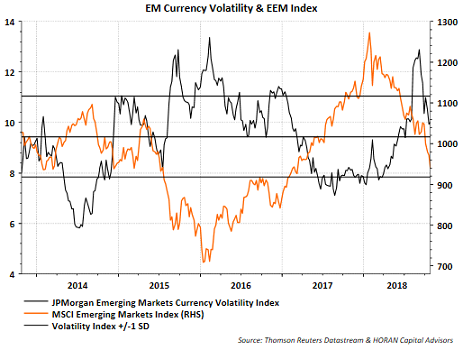
And finally, along with US dollar stability, vis-à-vis emerging markets currency, another factor that could lead to improved emerging market performance is a reduction in the volatility of emerging market currencies. Increasingly volatile emerging market currencies tend to be associated with weakness in emerging market equities. There is a high negative correlation, -.70, between the JP Morgan Emerging Markets Currency Volatility Index and the MSCI Emerging Markets Index. The below chart shows the currency volatility now declining, which historically has lead to improved emerging market equity performance.
October has been a tough month for investors. However, the recent market weakness may be creating potential investment opportunities and emerging markets might be a place for one to evaluate, keeping in mind the direction of interest rates relative to interest rates outside the U.S. will influence emerging market equity performance.
