Get 40% Off
👀 👁 🧿 All eyes on Biogen, up +4,56% after posting earnings. Our AI picked it in March 2024.
Which stocks will surge next?
Unlock AI-picked Stocks

Is The Monster Rise In Equities In Such A Short Time Unprecedented?

Published 06/11/2020, 01:01 AM
Updated 07/09/2023, 06:31 AM

You would think it had all caused me harm, what with all the fuss I made about the market’s rise. It’s just the insanity of it all, though. And I’m not trying to be a drama queen. Or king. Or any kind of emotional royalty. This has simply been insane. And that is a word I freely use, even having lived through the mayhem of 1999/2000.

The NASDAQ, of course, slipped right over the Big Round Number of 10,000, and the Perma bulls couldn’t be happier. Sort of like the effect the Big Round Number of 5,000 had back in March 2000, just before the 83% collapse.
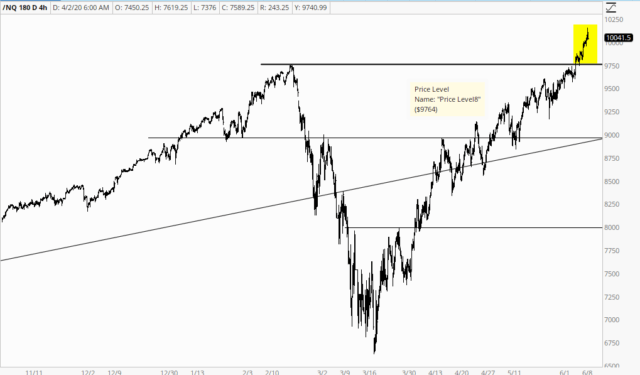
Nasdaq 4 Hr Chart

The ascent since March 23rd has been merciless, with the Fed large and in charge. That channel must be broken in order for even a scintilla of humility to return to the vacuous new “traders” out there.
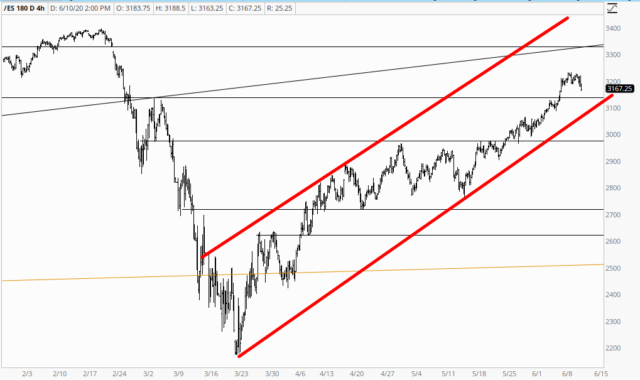
ES 4 Hr Chart

When I retired for the day on Tuesday evening, I had my eye on the pattern highlighted in yellow below. At the time, however, about 30% of the pattern didn’t even exist, so it was largely conjectural. Happily, though, what I perceived to be happening did, in fact, fully transpire. One day does not a trend break, but it’s a good thing on a small scale, at the very least.
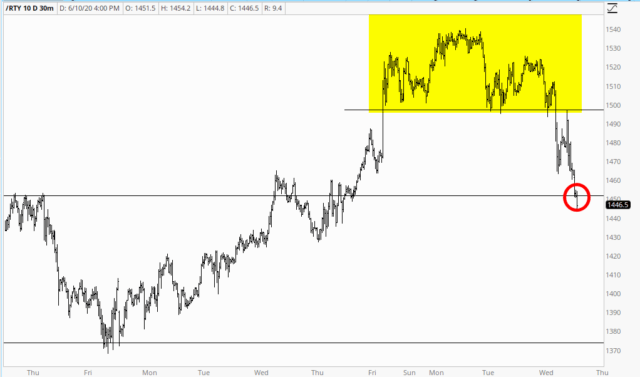
RTY 30 Min Chart

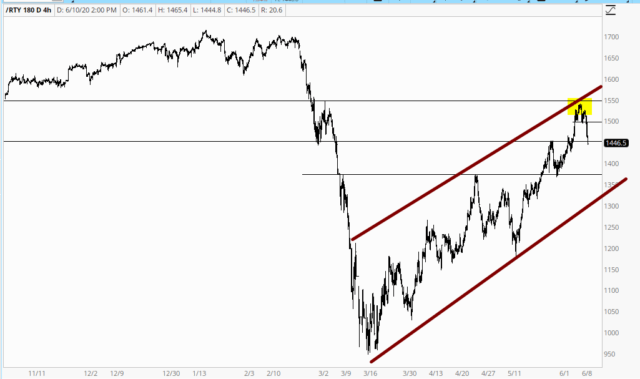
Viewed in a larger context, however, the head and shoulders on the small caps don’t amount to a hill of beans. As with the S&P 500 Futures above, the monster ascending channel needs to be shattered first.
3rd party Ad. Not an offer or recommendation by Investing.com. See disclosure here or remove ads .

RTY 4 Hr Chart

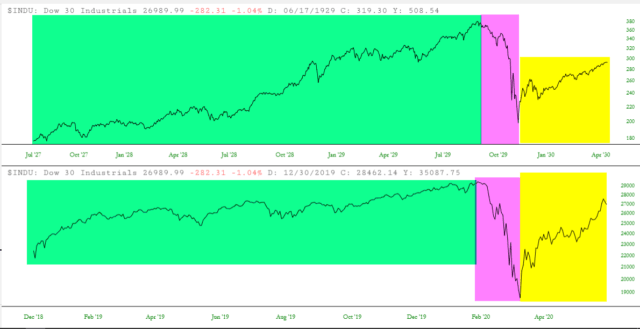
As a market historian, what I’ve been asking myself is if the monster's rise in equities in such a short space of time is unprecedented. The answer: no. There is, in fact, a very clear antecedent, and it took place in late 1929/early 1930.

By way of SlopeCharts, I have lined up this analog below, with the yellow zone showing, in both 1929 and 2020, the explosive nearly 50% ascent in equities following a heartstopping collapse.
INDU DJI Chart

This is the financial age of idiocy like I never imagined. 

Latest comments

Risk Disclosure: Trading in financial instruments and/or cryptocurrencies involves high risks including the risk of losing some, or all, of your investment amount, and may not be suitable for all investors. Prices of cryptocurrencies are extremely volatile and may be affected by external factors such as financial, regulatory or political events. Trading on margin increases the financial risks.
Before deciding to trade in financial instrument or cryptocurrencies you should be fully informed of the risks and costs associated with trading the financial markets, carefully consider your investment objectives, level of experience, and risk appetite, and seek professional advice where needed.
Fusion Media would like to remind you that the data contained in this website is not necessarily real-time nor accurate. The data and prices on the website are not necessarily provided by any market or exchange, but may be provided by market makers, and so prices may not be accurate and may differ from the actual price at any given market, meaning prices are indicative and not appropriate for trading purposes. Fusion Media and any provider of the data contained in this website will not accept liability for any loss or damage as a result of your trading, or your reliance on the information contained within this website.
It is prohibited to use, store, reproduce, display, modify, transmit or distribute the data contained in this website without the explicit prior written permission of Fusion Media and/or the data provider. All intellectual property rights are reserved by the providers and/or the exchange providing the data contained in this website.
Fusion Media may be compensated by the advertisers that appear on the website, based on your interaction with the advertisements or advertisers.
© 2007-2024 - Fusion Media Limited. All Rights Reserved.