
The Weekly Leading Index (WLI) of the Economic Cycle Research Institute (ECRI) is at 130.3, down slightly from athe previous week's 130.2 (revised from 130.4). The WLI annualized growth indicator (WLIg) fell to 4.6% from 5.2% the week previous (revised from 5.3%).
Last year ECRI switched focus to their version of the Big Four Economic Indicators that I routinely track. But when those failed last summer to "roll over" collectively (as ECRI claimed was happening), the company published a new set of indicators to support their recession call in a commentary entitled The U.S. Business Cycle in the Context of the Yo-Yo Years (PDF format).
At the end of May the company took a new approach to its recession call in its most recent publicly available commentary on the ECRI website: What Wealth Effect?.
A Broken Transmission
Despite surging prices for homes and equities, consumer spending is contracting, registering its biggest monthly decline since September 2009. Quite simply, the wealth effect is rendered moot by languishing incomes.
No wonder yoy U.S. import growth has also plunged into negative territory. In recent decades, this has happened only during U.S. recessions. Notably, unlike data for GDP and jobs, imports data are not revised substantially, long after the fact.
Some are surprised that inflation has failed to take off despite massive amounts of quantitative easing. The explanation is simple: recession kills inflation.
The commentary includes a brief discussion of the latest Personal Consumption Expenditure (PCE) deflator, which I've discussed in more detail here. It also includes an illustration of the shrinkage in US imports since the post-recession peak nearly three years ago.
The commentary concludes with a pointed observation:
The bottom line: for all the talk of the wealth effect, demand is falling and deflation is closer than at any time since 2009.
ECRI posts its proprietary indicators on a one-week delayed basis to the general public, but last year the company switched its focus to a version of the Big Four Economic Indicators I've been tracking for the past year. In recent months, however, those indicators have slipped below the fold, replaced by the mixed bag of whatever Indicator du Jour might look recessionary, as in the "Yo-Yo Years" commentary linked above. Likewise, see this March 7th Bloomberg video. At about the 2-minute point Achuthan reasserts his call that a recession began in the middle of 2012. In previous interviews he has specifically mentioned July as the business cycle peak, thus putting us in the 11th month of a recession.
Here is a chart of ECRI's data that illustrates why the company's published proprietary indicator has little credibility as a recession indicator. It's the smoothed year-over-year percent change since 2000 of their weekly leading index. I've highlighted the 2011 date of ECRI's recession call and the hypothetical July business cycle peak, which the company claims was the start of a recession.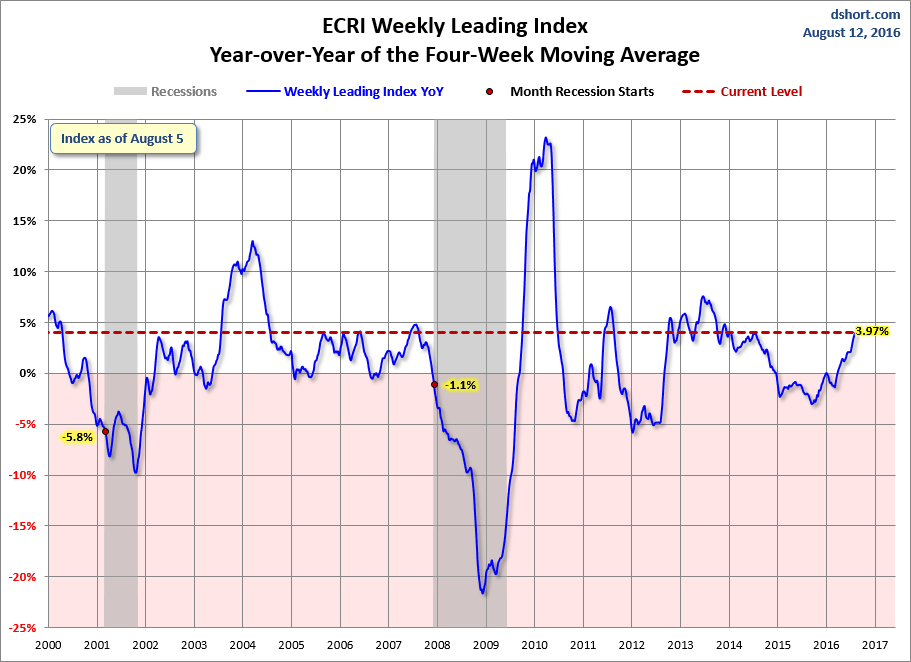
Here are two significant developments since ECRI's public recession call on September 30, 2011:
- The S&P 500 is up 43.6% and at a new all-time high as of yesterday's close.
- The unemployment rate has dropped from 9.0% to 7.6%.
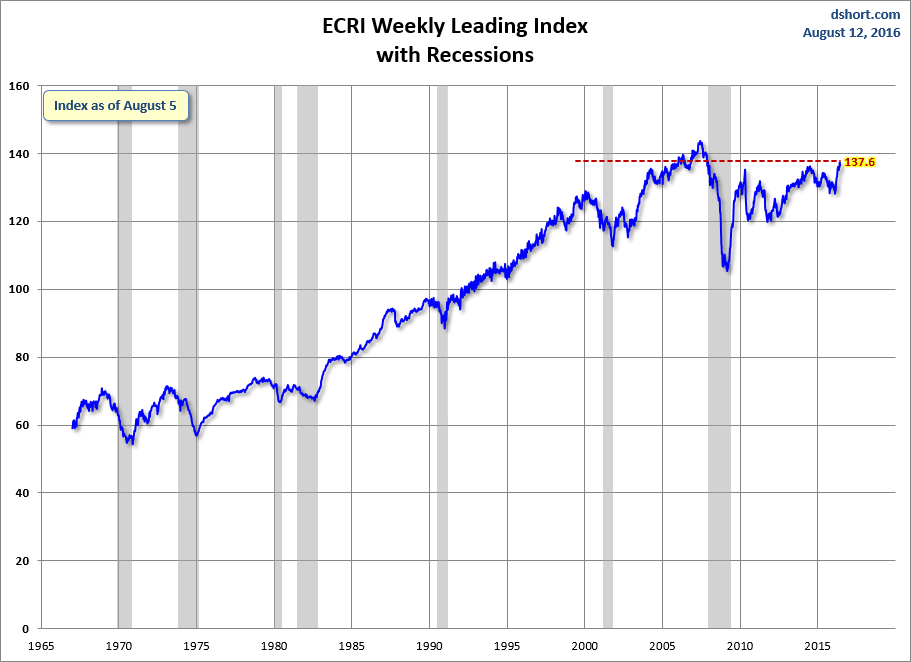
Appendix: A Closer Look at the ECRI Index

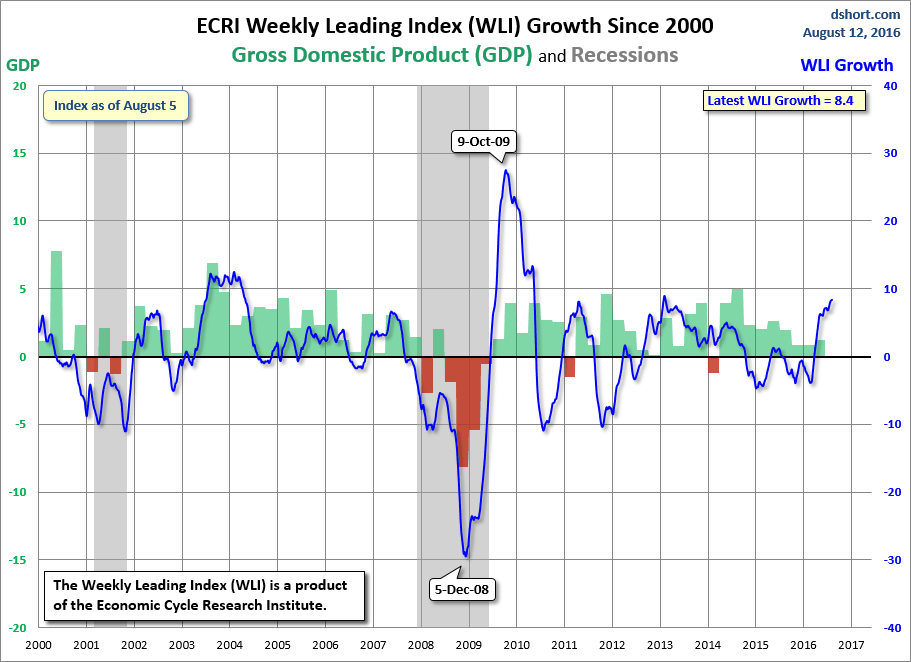
The WLIg Metric

The History of ECRI's Latest Recession Call
here
Year-over-Year Growth in the WLI
Why Our Recession Call Stands

substantially
Additional Sources for Recession Forecasts
RecessionAlert.com
this article

Earlier Video Chronology of ECRI's Recession Call
- September 30, 2011: Recession Is "Inescapable" (link)
- September 30, 2011: Tipping into a New Recession (link)
- February 24, 2012: GDP Data Signals U.S. Recession (link)
- May 9, 2012: Renewed U.S. Recession Call (link)
- July 10, 2012: "We're in Recession Already" (link)
- September 13, 2012: "U.S. Economy Is in a Recession" (link)
The three Ps: simple tools for monitoring economic cycles - pronounced, pervasive and persistent economic indicators
Here is the formula:
WLIg = [m*(MA1/MA2)^n] – m