The U.S. dollar managed to close last week with some gains although investors weren't very confident. Data from the Eurozone confirmed that inflation rose at a pace of 1.3% on the headline in January while core inflation was seen rising 1.0%. The data was unchanged from the flash inflation estimates.
Canada's inflation data rebounded rising 0.7% on the month as January's inflation reversed the 0.4% decline from December while also beating estimates.
Looking ahead, the economic calendar today will see ECB President Mario Draghi testifying to the European parliament in Brussels. Investors will be closely watching for any references to the ECB's monetary policies. The central bank is due to meet in a week's time for its monetary policy meeting.
Elsewhere, new home sales data will be coming out during the NY trading session. Forecasts point to a modest increase of 655k compared to 625k print registered previously. However, the U.S. housing markets data remained mixed over the past week and could potentially offer some surprises for the market.
Among the policy maker speeches, the BoE's MPC member, Cunliffe will be speaking while the Fed's Quarles will be speaking later in the day.
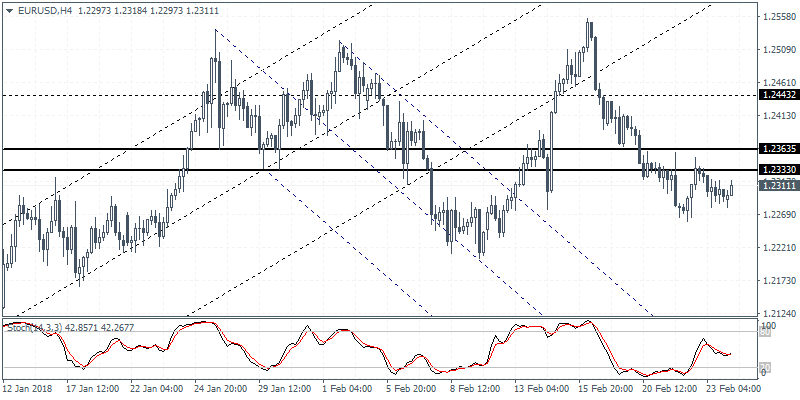
EUR/USD intra-day analysis

EUR/USD (1.2311):The EUR/USD was seen posting declines last week. Despite the attempts to close on a bullish note last Thursday, price action settled lower on the day. Friday's session closed within Thursday's range forming an inside bar as a result. We expect that the breakout will be to the downside given the retest of resistance level near 1.2363 - 1.2330 on the 4-hour chart. Unless EUR/USD posts a strong breakout to the upside, we expect to see the declines continuing lower in the medium term. EUR/USD remains on track to target the lows of 1.2212 from 9 February and a break down below this low will extend the declines to 1.2090.
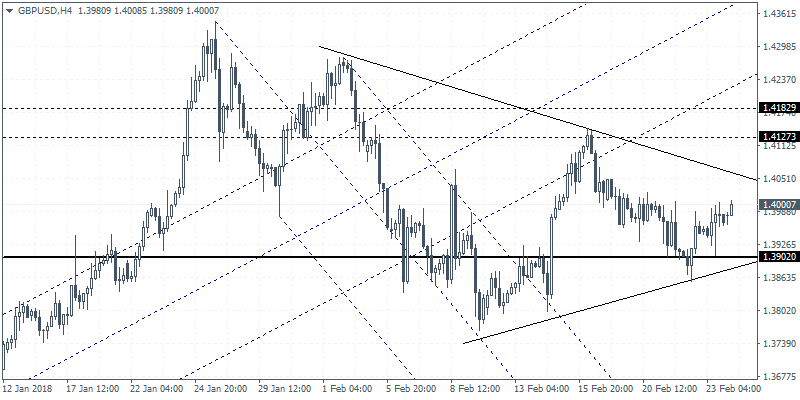
GBP/USD intra-day analysis

GBP/USD (1.4000):The British pound managed to close on a bullish note on Friday marking a two day gain. However with prices staying put near the highs above 1.3902, we expect to see some more consolidation taking place. To the downside, a break down below 1.3902 could potentially signal a move towards 1.353 level of support which could be tested once again. The gains to the upside will be limited with the next major resistance level at 1.4127 likely to cap the gains. With GBP/USD trading within the triangle pattern the breakout from this pattern will signal further direction in the currency pair.
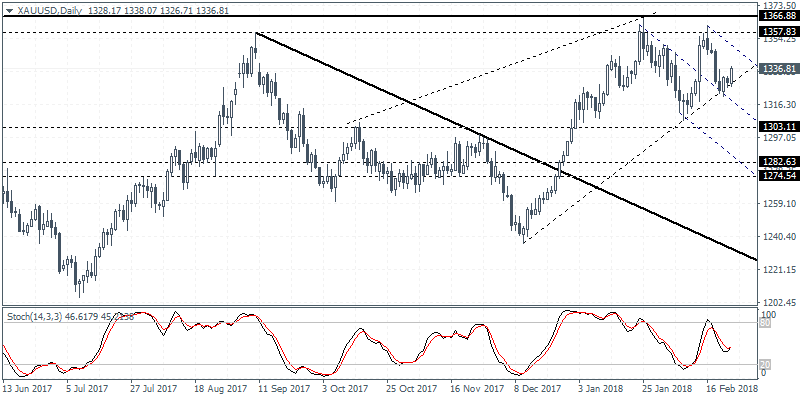
XAU/USD intra-day analysis

XAU/USD (1336.81):Gold prices edged lower last week after price failed to breakout from the resistance level near 1357. Overall, gold prices have formed a rising wedge pattern that suggests an imminent downside breakout. Friday's price action saw gold prices trading close to the lower trend line. A breakout from this will confirm the downside in gold. The first target comes in at 1303 and a break down below this level could extend gold prices to fall to 1282 - 1274 level. This would also mark a retest of the breakout from the trend line.
