The Tax Cut and Jobs Act’s (TCJA) cut in the corporate statutory tax rate at the end of 2017 will send earnings hurtling beyond the Earth’s gravitational pull this year into outer space.
They were heading in that direction last year. It’s conceivable that some of last year’s earnings' extravaganza was attributable to the Trump administration’s easing of regulatory costs. More likely is that 2017 earnings were boosted by the synchronized global economic expansion that followed the worldwide energy-led global growth recession from 2014 through 2016. I started to see signs of a global recovery during the summer of 2016, which led me to conclude that stock prices were likely to head higher no matter who won the presidential race on November 8, 2016. Trump won on his campaign promise to “Make America Great Again.” Earnings were on course to be great again in any event, and now they will be even greater thanks to the TCJA.
That simple insight led me to conclude that the meltdown in the stock market in early February was a flash-crash correction that would be short-lived given the meltup in actual and expected earnings. We now have the results for S&P 500 earnings during Q4-2017. They were HUGE. Consider the following:
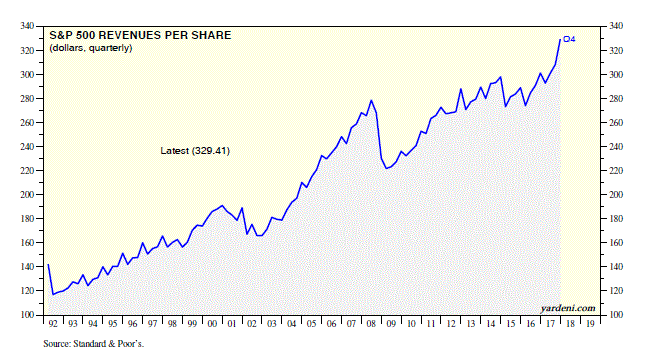
(1) Revenues. S&P 500 revenues rose to a record high of $329.41 per share at the end of last year. Remarkably, revenues per share rose 9.4% y/y, the fastest since Q3-2011. Needless to say, it’s hard to imagine that this fast pace was boosted by anything that can be traced to the White House, especially since almost half of S&P 500 revenues come from abroad. In the US, nominal GDP was up 4.4% y/y during Q4, lagging the 8.5% growth in S&P 500 aggregate revenues.
On the other hand, the trade-weighted dollar fell 7.0% y/y last year, which must have boosted revenues. As I previously observed, the dollar tends to be weak when the global economy is doing well and commodity prices are rising.
I’m not that surprised by the strength in revenues at the end of last year. That’s because it was clearly signaled by the weekly S&P 500 forward revenues series, which is the time-weighted average of industry analysts’ consensus expectations for revenues during the current year and the coming year. It continues to rise in record-high territory.
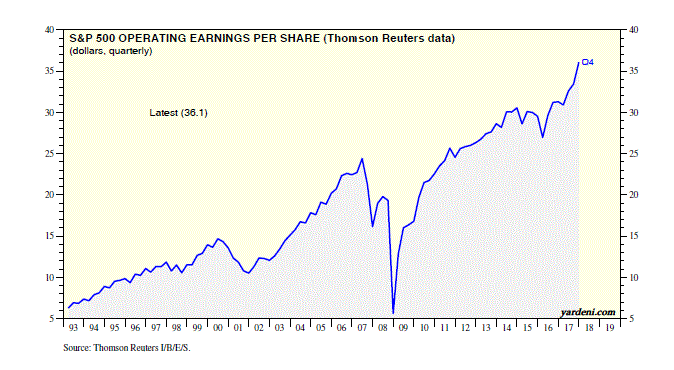
(2) Earnings. Also, I’m not surprised that S&P 500 operating earnings per share jumped 15.3% y/y during Q4-2017 according to Thomson Reuters. Nevertheless, I am certainly impressed. S&P also compiles operating earnings for the S&P 500 operating earnings using a more conservative approach for one-time nonoperating gains and losses. This measure rose even more impressively, with a 22.3% y/y gain.
Interestingly, S&P 500 reported earnings dropped sharply during Q4-2017, and was basically flat compared to a year ago. Weighing on earnings during the last quarter of 2017 were charges related to the TCJA, such as a substantial drop in the value of deferred tax assets given that the corporate tax rate was cut from 35% to 21%.
Again, I’m not surprised by the strength in earnings. It was clearly signaled by the weekly S&P 500 forward operating earnings. The four-quarter sum of S&P 500 operating earnings per share (based on the Thomson Reuters data) was $133 last year. The forward earnings series suggested in late February that earnings are headed toward $160 per share this year. That would be a 20% jump.
At the end of February, the analysts’ consensus earnings estimate for 2018 was actually $157.92, a 19.1% y/y gain. I am currently forecasting $155.00, a 16.8% increase. In any event, earnings will be up HUGEly this year.
(3) Profit margin. Now let’s take a moment to remember all those growling bears who have been trampled by the stampeding bulls since 2009. I miss them. I would have more confidence in the longevity of the bull market if they were still growling (as they mostly did from 2009-2013) that the bull market was on a sugar high and that earnings would be disappointing, or that the profit margin would soon revert to its mean.
The flash crash a few weeks ago might have given the bears a reason for living, but it was too short-lived. And here’s another disappointing flash for the bears: The operating profit margin of the S&P 500 rose to a new record high during Q4. It was 11.0% based on Thomson Reuters data and 10.4% based on S&P data. It will be higher during Q1-2018 thanks to the TCJA.
The bears could make a comeback if President Donald Trump turns into an outright protectionist. More likely is that he will back off if the market continues to react badly to his protectionist pronouncements. After all, he clearly prefers the Dow Jones Industrial Average as a measure of his popularity rather than opinion polls. Could this sharp stock market selloff on news that Trump intends to slap tariffs on steel and aluminum imports be the incipient formation of the Dow Vigilantes?

