Get 40% Off
🚨 Volatile Markets? Find Hidden Gems for Serious OutperformanceFind Stocks Now

Dow Jones Industrials Testing Monster Breakout Level

Published 06/09/2021, 10:53 AM
Updated 07/09/2023, 06:31 AM

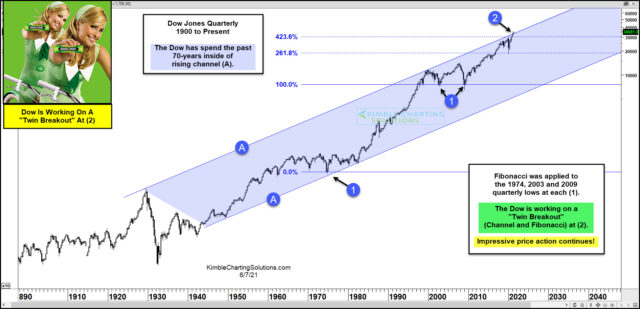
Dow Quarterly Chart.

The past year has seen a strong, persistent rally on the Dow Jones Industrial Average.

Could there be further upside in store? Perhaps another monster rally? Let's look at the chart.

Today’s chart takes a very long-term view of the Dow Industrials. This “quarterly” chart illustrates the long-term rising bull market channel with blue shading marked by each (A). Taking our analysis one step further, we can apply Fibonacci to the 1974, 2003, and 2009 lows marked by each (1).

As you can see, the Dow Industrials broke out over the 100% Fibonacci extension before retesting it twice. It then moved out over the 261.8% Fibonacci before testing it last year. And now the Dow Jones Industrial Average is trying to breakout over the 423.6% Fibonacci. This area also marks the upper end of the rising channel at (2), making it a “twin breakout” resistance area.

Will the Dow Industrials pause here or break out?

If the Dow Industrials can record a “twin breakout” at (2), another leg higher in the bull market may be in store. Stay tuned.

Latest comments

just thought id mention theres a typo in the headline of this article. .. didnt you mean to write ' dow jones industrials testing a monster breakdown level' ? ... what you wrote doesnt even make sense.
Risk Disclosure: Trading in financial instruments and/or cryptocurrencies involves high risks including the risk of losing some, or all, of your investment amount, and may not be suitable for all investors. Prices of cryptocurrencies are extremely volatile and may be affected by external factors such as financial, regulatory or political events. Trading on margin increases the financial risks.
Before deciding to trade in financial instrument or cryptocurrencies you should be fully informed of the risks and costs associated with trading the financial markets, carefully consider your investment objectives, level of experience, and risk appetite, and seek professional advice where needed.
Fusion Media would like to remind you that the data contained in this website is not necessarily real-time nor accurate. The data and prices on the website are not necessarily provided by any market or exchange, but may be provided by market makers, and so prices may not be accurate and may differ from the actual price at any given market, meaning prices are indicative and not appropriate for trading purposes. Fusion Media and any provider of the data contained in this website will not accept liability for any loss or damage as a result of your trading, or your reliance on the information contained within this website.
It is prohibited to use, store, reproduce, display, modify, transmit or distribute the data contained in this website without the explicit prior written permission of Fusion Media and/or the data provider. All intellectual property rights are reserved by the providers and/or the exchange providing the data contained in this website.
Fusion Media may be compensated by the advertisers that appear on the website, based on your interaction with the advertisements or advertisers.
© 2007-2024 - Fusion Media Limited. All Rights Reserved.