As investors continue to believe the stock market correction is over, the next big stop for the Dow Jones Index is 19,000. When the Dow falls below 19,000, all doubt will be removed as the best investment strategy would be to sell the rallies, rather than buy the dip. However, most investors buy at the top and sell at the bottom. So, it looks like investor carnage will continue for the foreseeable future.
I am quite surprised that investors don’t see the writing on the wall as it pertains to the most overvalued stock market in human history. While the PE Ratio of the S&P 500 isn’t as severe as it was in 1999, the debt, leverage, and margin are orders of magnitude higher. For example, in 1999 the U.S. Govt. debt was only $5.6 trillion compared to the $21 trillion today. Also, with higher debt levels comes higher interest payments.
Unfortunately, the U.S. Government and the economy is in a nasty feedback loop heading towards destruction. You can’t continue to print money, increase debt and leverage without causing severe disruptions in the future.
Today, investors have become way too complacent as the broader markets trade near their highs. However, as the markets really start to fall, complacency will eventually turn to panic. According to my analysis, the next critical level for the Dow Jones Index is 19,000:
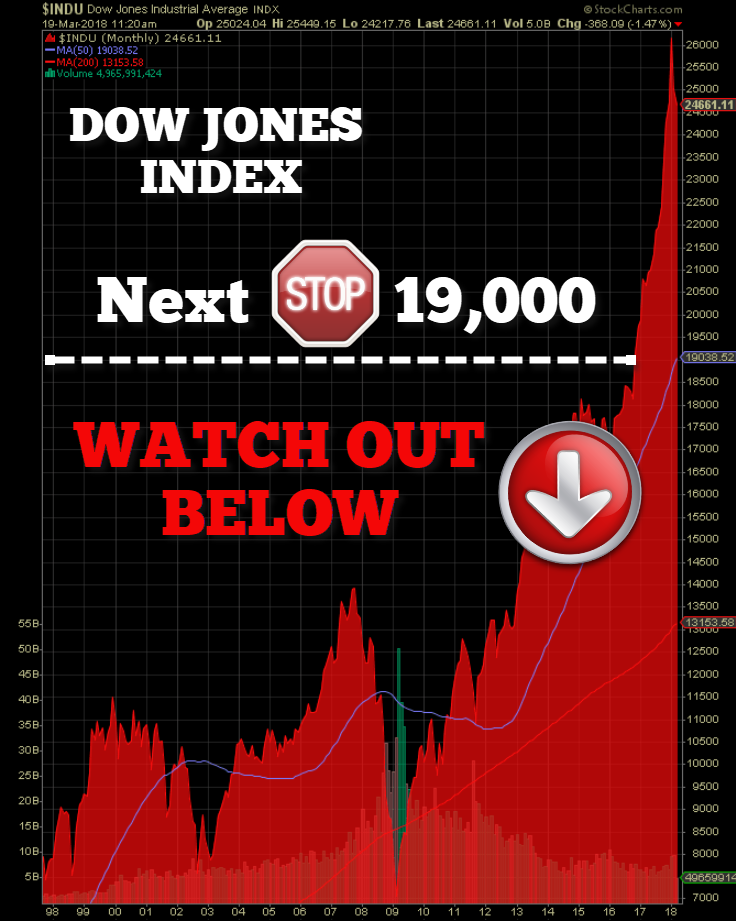
I picked the 50-month moving average (MMA), shown in the blue line as the first critical level. Once the Dow Jones Index falls below 19,000, the next critical level will be 13,000, or the 200 MMA (in red). These levels aren’t “possibilities,” but rather, “guarantees” to occur over the next few years. Why do I say a guarantee? Well, if we look at some of the insane stock price charts below, you would have to be a complete imbècil to arrive at a different conclusion.
First…. let’s start with one of the FANG stocks, and look at Facebook's (NASDAQ:FB) price chart as it has been receiving some negative press in the media presently:
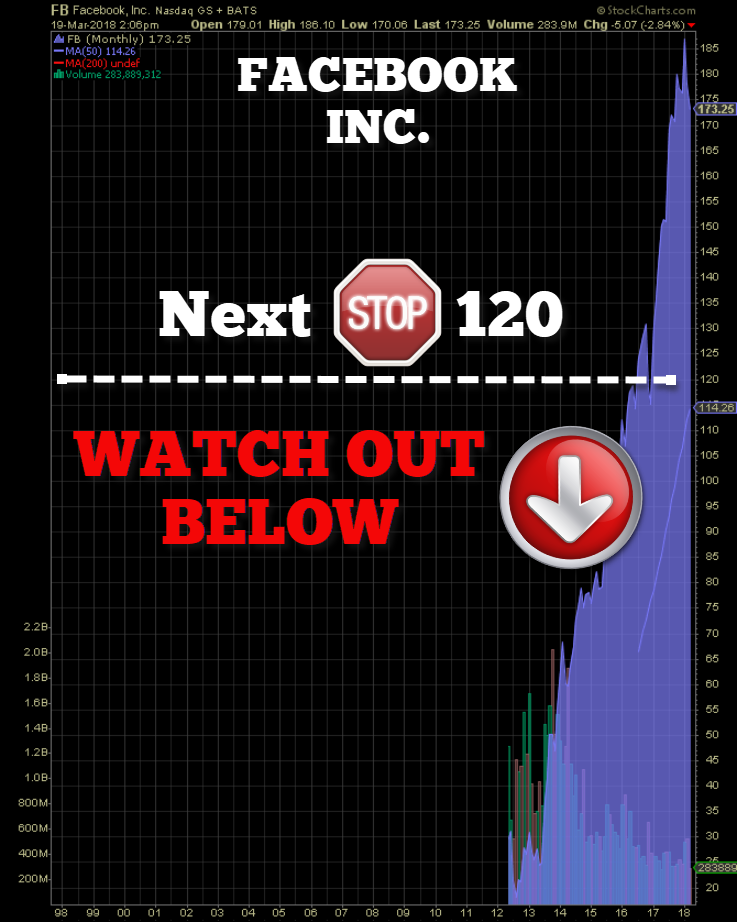
Facebook (NASDAQ:FB) is a relatively new company that has seen its share price increase from $20 in 2012 to a peak of $185. However, the knowledge that Facebook uses its clients’ information to push certain political agendas, etc, has driven its price down another 5% today. While Facebook makes a lot of money from its advertising business model, during a market meltdown, its share price will fall along with the rest.
Second… the next stock itching for a huge correction is Amazon (NASDAQ:AMZN). Currently, Amazon is trading at over $1,500 a share. That’s one hell of a share price when we consider that it was trading ten times less that amount at $150 in 2012:
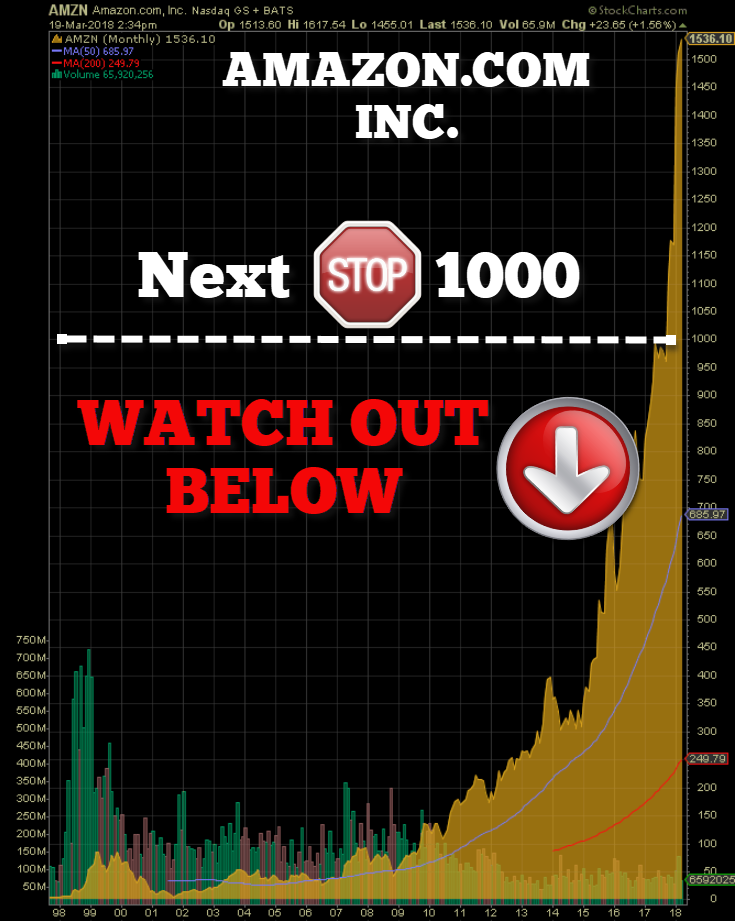
Since the beginning of 2017, Amazon’s share price has surged from $850 to $1,500. However, the company’s net income is only 1% of its total revenues, and with a 257 PE Ratio, Amazon is one truly expensive stock. Watch out below if Amazon takes out its $1,000 level. If we look at Amazon’s 50 MA of $686 and 200 MA of $250, the collapse of its share price will most certainly be quite similar to the gutting of the Cryptocurrency market.
For example, Ripple is one of my favorite cryptocurrencies to use as a perfect example of what’s wrong with the crypto market. Ripple is one of the best examples of a bubble in recorded history. From trading at a fraction of a penny to $3.00, Ripple provided a very very brief illusion of massive digital wealth for its investors:
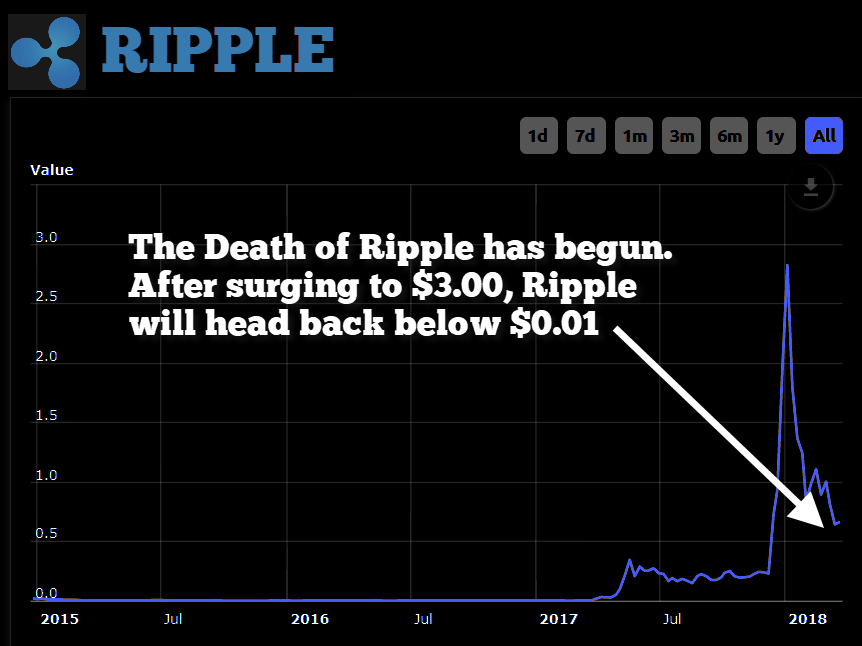
Now, if you were able to buy at the bottom and sell near the top, you have my praise. However, most investors do not buy at the bottom and sell at the top. So, I would imagine only a fraction of Ripple investors made handsome profits. Those Ripple investors listening to the supposed Crypto Aficionados who are advising HODLing & BUYing the Dip will probably regret it as Ripple heads back to a penny… or below.
I would like to remind my followers that I stated that Bitcoin and the cryptos were in a MASSIVE BUBBLE last year. Currently, Bitcoin is 54% off its high while Ethereum and Ripple are down 56% and 75% respectively from their peaks. Unfortunately, the crypto market selloff isn’t over yet as nothing goes down in a straight line. I can assure you, no bubble in history surpassed its peak. Thus, I highly doubt Ripple will ever see $3.00 again.
Okay… getting back to real companies and their inflated stocks. The last example of a stock that has one hell of a long way to fall is Netflix (NASDAQ:NFLX). While a lot of people use Netflix, the company isn’t making any money. So, I don’t believe its present $310 share price will last long:
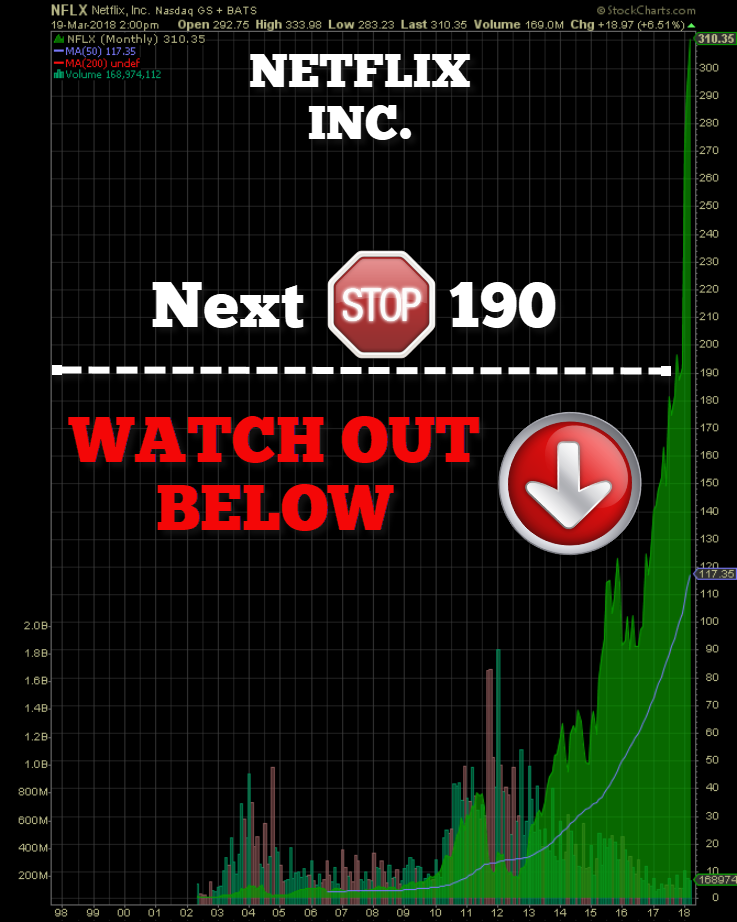
If Netflix’s share price chart over the past few months resembles the Antenna on top of the Empire State Building in New York, then your brain is functioning correctly. In just a few months, Netflix has shot up from $190 to over $300. Now, if you can’t see any trouble here and believe Netflix is a good place to put your hard-earned money, I would suggest the best action might be just flush your Federal Reserve Notes down the toilet now and forgo any future frustrations.
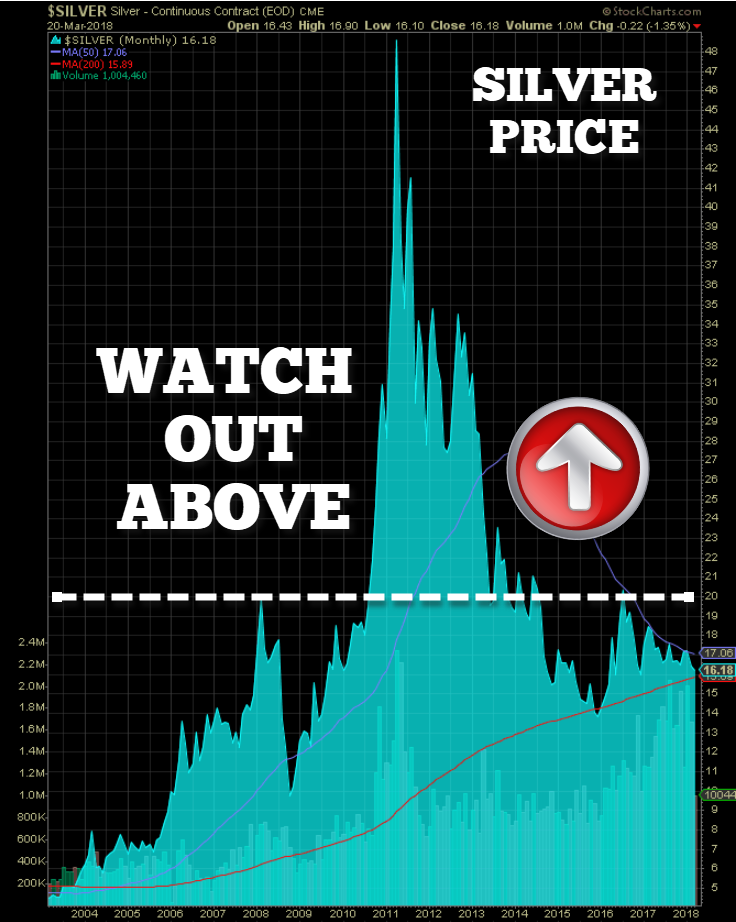
However, if you can see just how highly overvalued the stocks above are, then it might be prudent to invest in something that is trading closer to its lows. The silver price is currently trading at its 200 MA and below its 50 MMA:
I believe investors need to start thinking about PROTECTING WEALTH rather than BUILDING WEALTH. The next few years are going to be tumultuous, so the best strategy is to keep what you have than losing a lot in the markets. But, of course, 99% of investors will not protect their wealth during the coming downturn. And to make matters worse, a falling stock market is bad for the oil price. So, as the oil price falls, it will crush the already weakened U.S. Shale Oil Industry.
Lastly, I will be putting out a new video over the next few days about the markets on my youtube channel.
