Get 40% Off
🚨 Volatile Markets? Find Hidden Gems for Serious OutperformanceFind Stocks Now

Dow ETF Looks Ripe For A Pullback

Published 06/21/2017, 01:28 AM
Updated 05/14/2017, 06:45 AM

The bullish sentiment in the options market for the SPDR Dow Jones Industrial Average (NYSE:DIA) has gotten overdone, and the ETF is due for a short-term downturn.

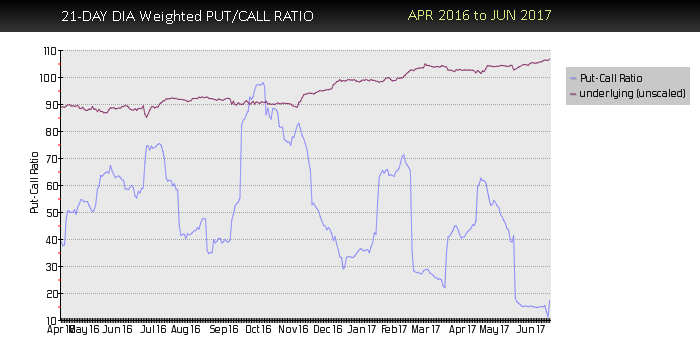
That’s the message from the options experts at McMillan Analysis Corp., who today published a note that their computer generated dollar weighted Put-Call Ratio Sell Signal has been visually confirmed by DIA’s chart (see below):

21-Day DIA Weighted PUT/CALL RATIO

As you can see in the chart above, DIA’s put-call ratio has plunged to historically low levels on a dollar weighted basis. This means that far more bullish bets are being placed on DIA than bearish bets.

When this ratio gets to either extreme, the tendency is for a stock or ETF to correct in the near term as the very crowded trade unwinds. While not a guarantee that DIA will plunge, investors are wise to add this indicator to their toolbox because it has a solid track record as a prescient near-term signal.

For more on put-call ratio and its value as a contrarian indicator, here’s McMillan’s explanation:

Put-call ratios are useful, sentiment-based, indicators. The put-call ratio is simply the volume of all puts that traded on a given day divided by the volume of calls that traded on that day. The ratio can be calculated for an individual stock, index, or futures underlying contract, or can be aggregated – for example, we often refer to the equity-only put-call ratio, which is the sum of all equity put options divided by all equity call options on any given day. Once the ratios are calculated, a moving average is generally used to smooth them out. We prefer the 21-day moving average for that purpose, although it is certainly acceptable to use moving averages of other lengths.

3rd party Ad. Not an offer or recommendation by Investing.com. See disclosure here or remove ads .

The SPDR Dow Jones Industrial Average ETF was trading at $214.92 per share on Tuesday afternoon, flat on the day. Year-to-date, DIA has gained 8.81%, versus a 9.06% rise in the benchmark S&P 500 index during the same period.

DIA currently has an ETF Daily News SMART Grade of A (Strong Buy), and is ranked #5 of 75 ETFs in the Large Cap Value ETFs category.

Latest comments

Risk Disclosure: Trading in financial instruments and/or cryptocurrencies involves high risks including the risk of losing some, or all, of your investment amount, and may not be suitable for all investors. Prices of cryptocurrencies are extremely volatile and may be affected by external factors such as financial, regulatory or political events. Trading on margin increases the financial risks.
Before deciding to trade in financial instrument or cryptocurrencies you should be fully informed of the risks and costs associated with trading the financial markets, carefully consider your investment objectives, level of experience, and risk appetite, and seek professional advice where needed.
Fusion Media would like to remind you that the data contained in this website is not necessarily real-time nor accurate. The data and prices on the website are not necessarily provided by any market or exchange, but may be provided by market makers, and so prices may not be accurate and may differ from the actual price at any given market, meaning prices are indicative and not appropriate for trading purposes. Fusion Media and any provider of the data contained in this website will not accept liability for any loss or damage as a result of your trading, or your reliance on the information contained within this website.
It is prohibited to use, store, reproduce, display, modify, transmit or distribute the data contained in this website without the explicit prior written permission of Fusion Media and/or the data provider. All intellectual property rights are reserved by the providers and/or the exchange providing the data contained in this website.
Fusion Media may be compensated by the advertisers that appear on the website, based on your interaction with the advertisements or advertisers.
© 2007-2024 - Fusion Media Limited. All Rights Reserved.