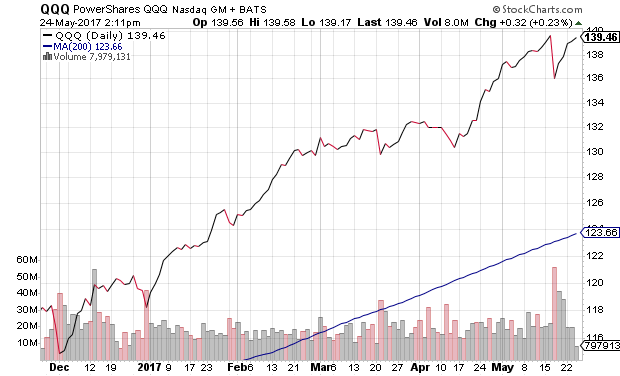
Remember when the financial markets believed that tax cuts, regulatory reform and infrastructure spending would rev up the economic growth engine? The dollar surged. Bonds cratered. And stocks broke out of a 22-month collective funk.
Yet expectations that a “business-friendly” Trump will offset higher borrowing costs have faded considerably. Consider the flattening of the yield curve. The spread between shorter-term 2-year Treasury yields and longer-term 10-year Treasury yields is back below a scant 1 percentage point. This is more indicative of recessionary pressure and disinflation, not economic acceleration and inflation.
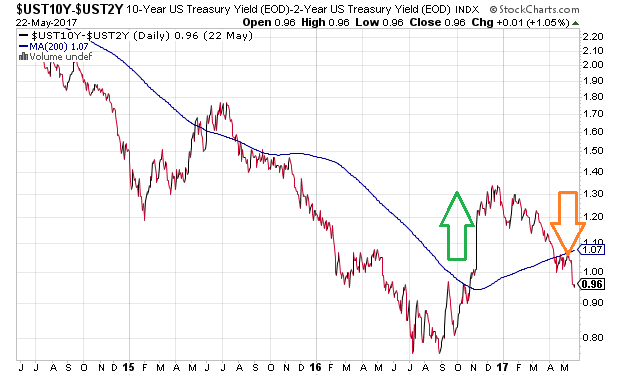
The bond community is nervous enough to keep acquiring risk-off assets at artificially depressed yields. And yet, stock enthusiasts are maintaining their swagger.
How cocky are equity buyers at all-time record highs? The price ratio of the performance between the MSCI USA Growth Index and the MSCI World Value Index has surpassed the peak last seen during the dot-com bubble (2000).
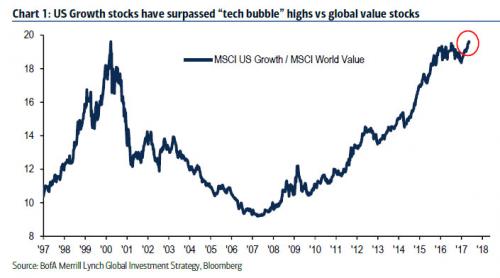
The MSCI USA Growth Index is led by its top holdings – Facebook (NASDAQ:FB), Apple (NASDAQ:AAPL) and Amazon (NASDAQ:AMZN) and Alphabet/Google (NASDAQ:GOOG). The heavily leveraged herding into these mega-cap growth names is largely a function of the collective presumption of permanently low interest rates. The problem? Speculative euphoria rarely ends well.
When it comes to speculative jubilation, I tend to think a bit about Hyman Minsky. The American economist disagreed with conventional thinking that a crisis required an exogenous shock, like a military invasion, a super-spike in commodity prices or a ground-breaking game-changer like the Internet. Instead, Minsky felt that a modest economic expansion could, in and of itself, lead to lax standards in the financial system. (Think financial meltdown circa 2008.) Minsky even put forward a model for our system of credit, where the system shifts between heartiness and feebleness.
The question, then, where does our credit-based economy stand today? Well, data on loans to businesses (a.k.a. “commercial and industrial (C&I) loans”) aren’t particularly robust. In fact, C&I loans have experienced an absence of credit growth for 30 consecutive weeks (7 months).
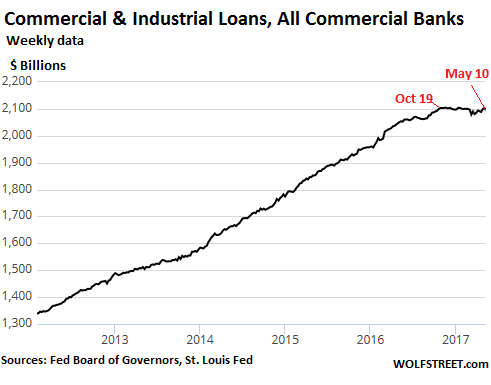
Isn’t it fair to say that when a company is borrowing to expand upon its core competencies – employing credit to acquire land, machinery, human resources and/or fund projects – executives are confident about their prospects? Conversely, when those same executives are reining in the use of credit, might that be a sign of apprehension about the business environment?
This brings us back to another idea attributed to Minsky, a “Minsky Moment.” That’s when overly aggressive investors come to a collective realization that excessive debt ratios may not be indefinitely ignored. And as the value of riskier assets begin to fall, the crowd rushes for the exit door, creating a negative feedback loop for more dramatic drops in asset prices.
For now, though, excessive debt is being overlooked. Total credit market debt — household, business, government, financial — sits at $66 trillion and 350% of GDP.
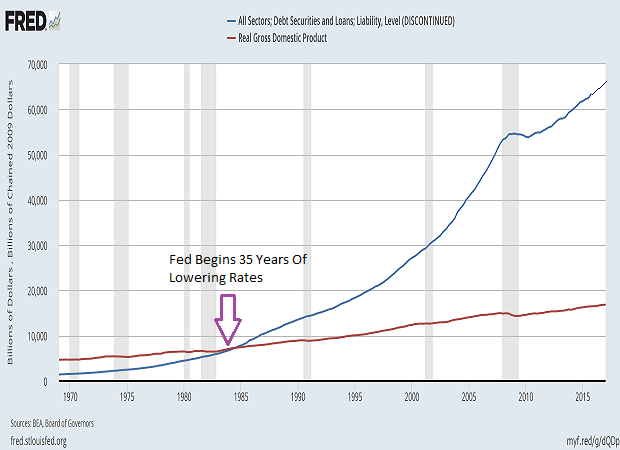
Keep in mind, former Fed Chair Volcker explained in an interview in Q4 of 2016, ” Our current debt may be manageable at a time of unprecedentedly low interest rates. But if we let our debt grow, and interest rates normalize, the interest burden alone would choke our budget and squeeze out other essential spending.”
Translation? Rates better remain constrained because total credit market debt is growing by bounds and leaps. The federal government alone is likely to run $1 trillion deficits. And households? Household debt has now reached an all-time high of $12.73 trillion.
“Nobody cares, Gary. Rates have been range-bound and they’re not going to move meaningfully higher,” argues the aggressive stock market investor. On that we can agree. I don’t think borrowing costs in the belly of the curve are going to budge, even as the Federal Reserve continues its tightening campaign. And that is a recipe for even more curve flattening, if not near-inversion or inversion along spots on the three decade curve. (Note: A decade of near-zero overnight lending rate policy by the Fed makes actual inversion unlikely.)
My contention is that low rates alone won’t be good enough in the absence of monumental fiscal stimulus (e.g., tax cuts, regulatory reduction, infrastructure improvement, etc.). On the contrary. Rates will have to move even lower, as they have for the three-and-a-half decades of Greenspan/Bernanke/Yellen in order for ever-increasing debts to be manageable. If they stay the same, interest expenses will chew up even more of household, business and government budgets.
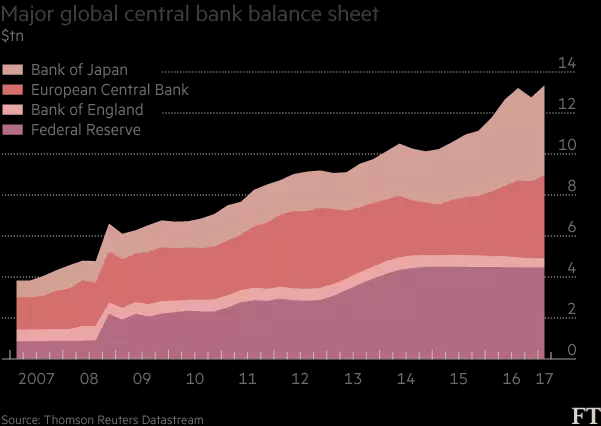
Granted, debt woes simply have not mattered while central banks around the globe pump out enormous liquidity. Neither has ridiculous stock overvaluation. Over the past year alone, the world’s central banks have acquired $1.8 trillion in assets – money that later finds its way into riskier holdings held by everyone other than the central banks. Not to be completely outdone, the Fed may have stopped growing its balance sheet in December of 2014, but it still maintains the $4.5 trillion by reinvesting $30 billion per month.
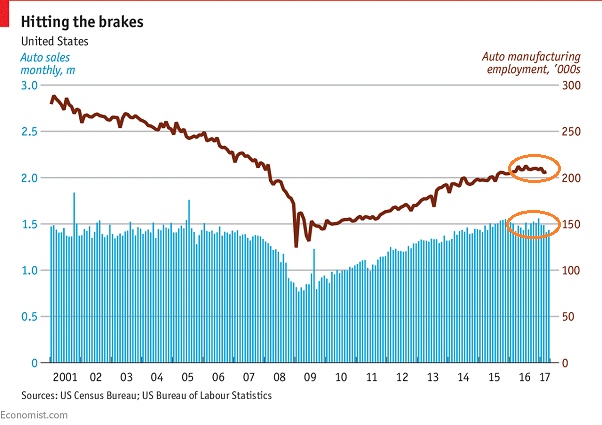
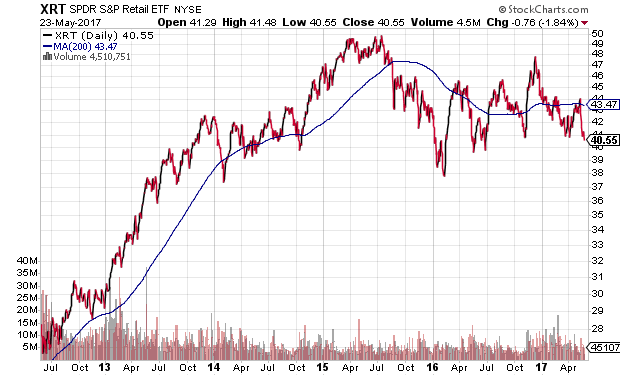
On the flip side, the flattening of the yield curve is a reflection of a concern that additional stimulus – monetary or fiscal – may not be coming. If that’s the case, wouldn’t the slowdown in autos be bothersome? Similarly, wouldn’t the decline of brick-n-mortar retail, as well as the real estate associated with it, be vexing?
I am not suggesting that a “Minsky Moment” is rapidly approaching. Nevertheless, with the PowerShares QQQ Nasdaq 100 Tracking Stock (NASDAQ:QQQ) 11.3% above a 200-day moving average, the probability of a mad scamper away from the mega-cap growth space is rising. Maybe you will buy the dip. Or maybe the ghost of Mr. Minsky will have the final laugh.