The TIC data for May was inconsistent. It has been that way for several months, and importantly describes what I think is the operative “dollar” condition. Though the data is several months old already, we can tell by certain real-time prices and indications that the difference between 2016 and 2017 is very clear in some parts, and none in others.
The headline data, for TIC anyway, is a perfect example. The monthly net transactions are broken into two broad categories: private foreign net purchases of US dollar assets, and those conducted by foreign official institutions (largely central banks).
Despite a few months ago the media running stories about foreign UST holders getting anxious about a Trump administration, in June no such apprehension was anywhere to be found. Private investors bought the most (net) UST’s since June 2015. Combined with a heavy net positive for corporate bonds, foreign holders added the most US$ assets two months ago going all the way back to August 2010!
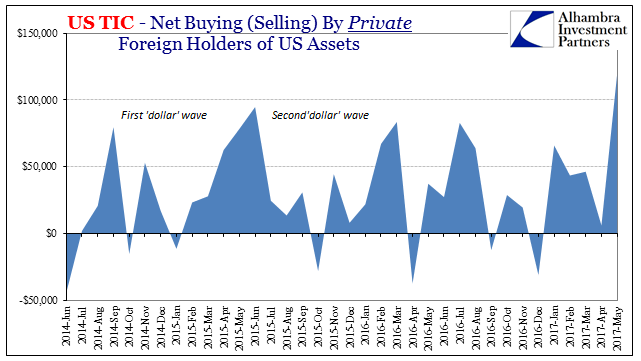
While that may suggest renewed vigor for US stuff, the official side sold, on net, the most US$ assets since January. While that isn’t a long ago comparison that gets attention, official sector selling in January was far too much like the past few years. That indicates a high degree of intervention in favor of foreign “dollars” which wouldn’t be necessary under even close to normal conditions.
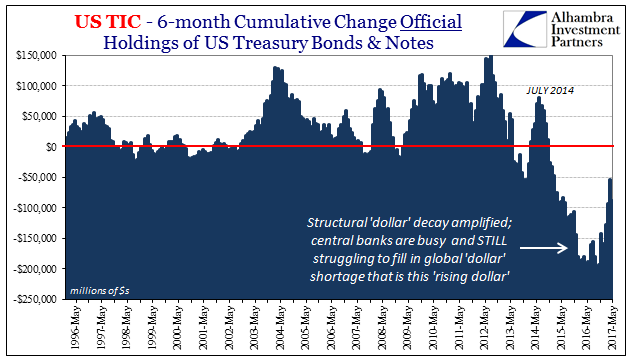
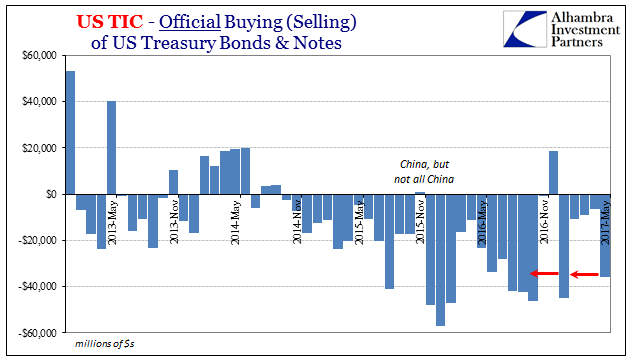
The latter’s (official) net sales are surely being done so that the former’s (private) purchases can be. This doesn’t mean that foreign central banks are trying to aid the US Treasury in the demand for federal paper, rather that in steadying foreign “dollar” markets as best as might be possible overseas officials are hoping that will allow regular commerce and flow to resume on their shores. Foreign net purchases of UST and other US$ assets would be consistent with that process.
But there is a catch, and a big one. For the “rising dollar” these official activities (along with others that won’t ever show up in statistics and accounting statements) were often easily overwhelmed by global banking flight. I highly doubt that in May 2017 they suddenly became more effective to the degree we see in “output” on the private side.
What changed was surely bank-created “dollar” liabilities that are, as the headline TIC figures, now inconsistent. Relative to last year, that, too, is a positive step, but not one that would suggest recovery and possible systemic restoration.
In May, however, the estimates for bank reported dollar liabilities were…interesting. It’s too early to tell whether we are seeing retrenchment again or if the quarterly pattern of bank behavior is changing. If it is the latter, then there is no way of knowing what is really going on; if the former, then that would help explain further the “conundrum” and other anti-“reflation” aspects over that period.
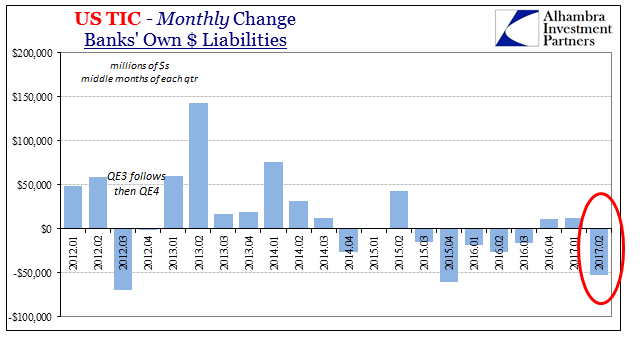
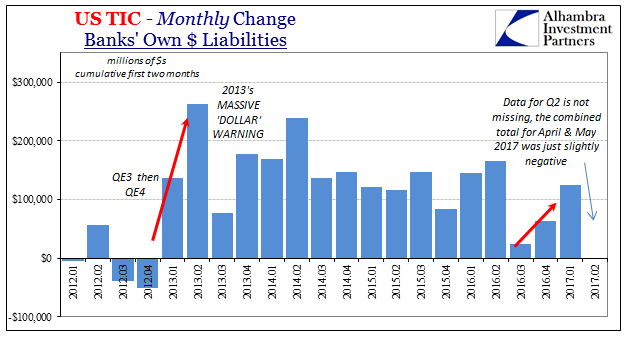
For May, a middle month in the quarterly cycle, there was a rather large drawdown in reported liabilities – the worst since Q4 (November) 2015. That followed in April a small uptake after a very small end-of-quarter decline due to regular window dressing. For the two months of Q2 2017 combined, the TIC data suggests a very weak “dollar” environment on the bank side (perhaps why the official sector was so heavily re-engaged in selling UST’s).
From the earnings data of the major banks released to this point about Q2, it would seem more likely that “dollars” were again hard(er) to come by rather than a drastic alteration in the quarterly pattern. The revenue numbers in FICC were from bad to atrocious, which would unfortunately be consistent with what you see above.
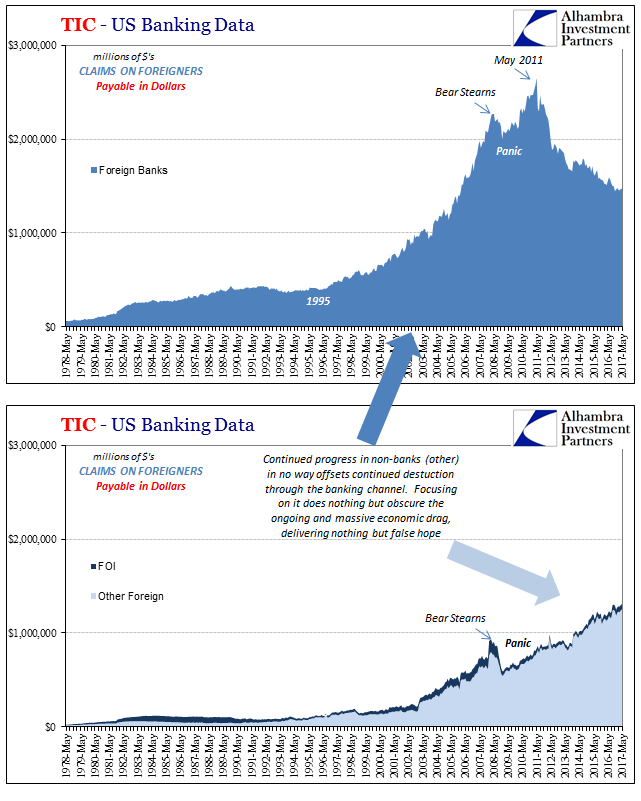
In terms of geographical dispersion, the TIC estimates leave us with, once again, inconsistency. The difference between bank and non-bank “supply” remains as stark as ever, with banks retreating still on both sides of the cross-border system (“Claims On” and “Liabilities To”). Over the past few months, that difference was lessened as the decline in bank-drawn “dollars” wasn’t as severe as in 2015-16. Thus, the continuing increase in non-bank offerings was since around January enough to mitigate the contraction.
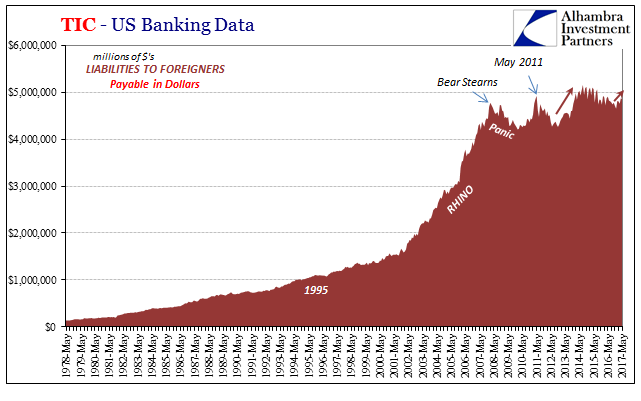
Going in the other direction, Liabilities To, there has been a slight increase in “dollars” going back to December. Notably, however, it is so far much less than the same kind of expansion during the last “reflation” in 2013-14. That’s an important benchmark for comparison.
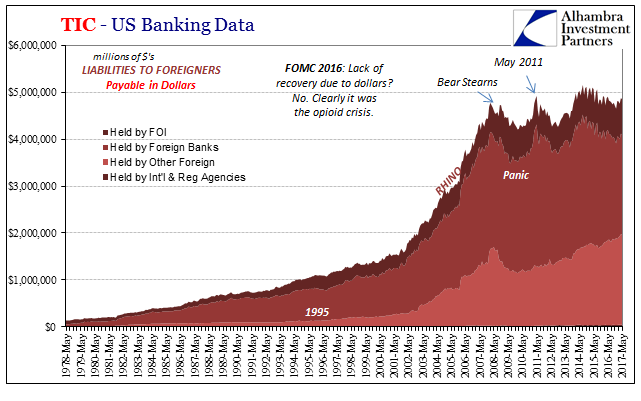
It was European banks most interested in recouping some “dollar” capacity, relatively speaking, while Latin American banks continued heavily to the downside. In the middle was those firms in the original eurodollar/offshore locales, the Caribbean, who have been this year neither withdrawing nor retracing. And, as usual, doing their own thing entirely were the Japanese banks; at some distant day in the future their role in especially the post-2011 system will hopefully be fully exposed (looking at you, Hong Kong).
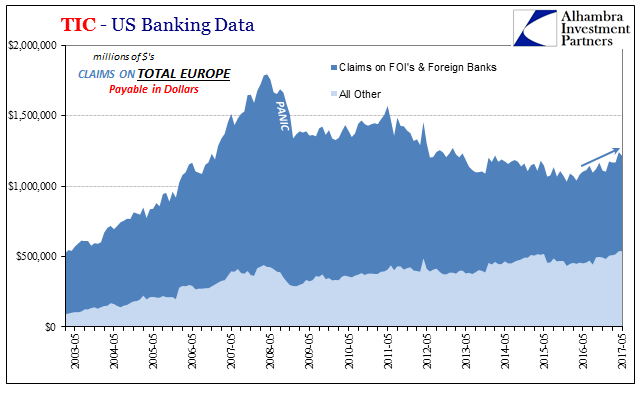
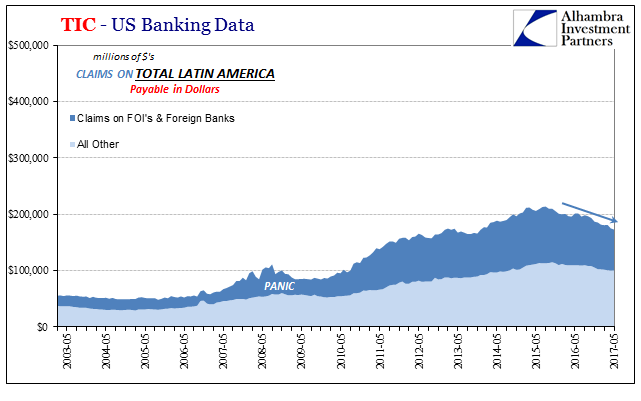
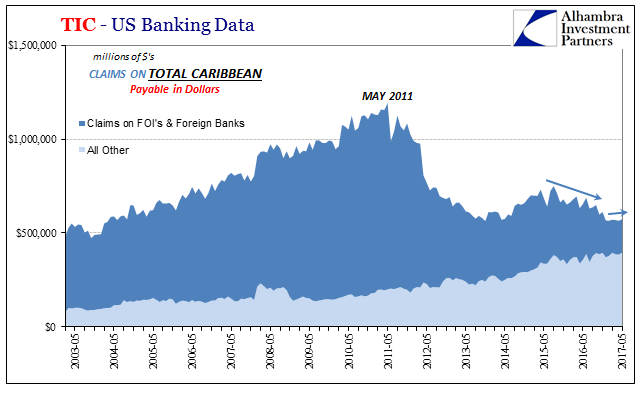
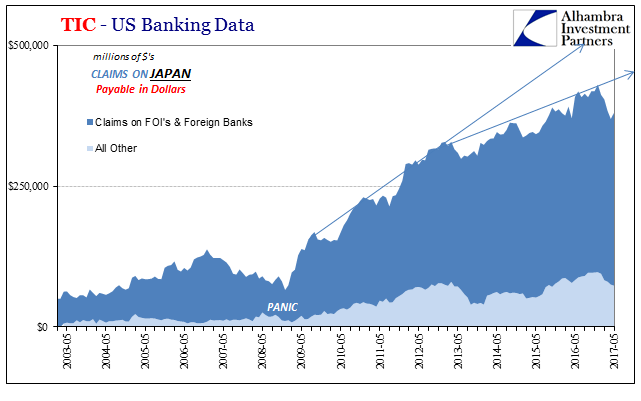
In short, consistently inconsistent. As noted at the outset, that’s better than 2016, but also far short of recovery. Where there are positives, there is no conviction (apart from private sector demand for UST’s and corporate bonds, at least in May). It isn’t improvement but merely the absence of further unified decay.
On the whole, the system continues to be fractured, thus the inconsistencies. That simply raises the risk of the “next one.” If I had to bet, should there be another “rising dollar” or something in funding like it, it will be the non-bank sector where it hits the hardest, perhaps even starts.
