Wednesday April 25: Five the markets are talking about
With US Treasury yields backing up, fixed income dealers are pricing in the possibility that there will be four Fed rate hikes this year and not the three they signaled in March.
Given US economic growth and signs that domestic inflation could be picking up, fed fund futures are pricing a +53% chance of four hikes, up from +48% on Monday and +33% a month ago.
Expectations for tomorrow’s European Central Bank (ECB) meeting are for a ‘low key’ event. The central bank’s ongoing forward bias would suggest that there is no chance of any change in the overnight base rate.
Since last month’s ECB’s meeting, the eurozone real economy has show signs of cooling – industrial production has extended its monthly declines to three, while retail sales is expected to eat into Q1 GDP growth and even investor and business sentiment has fallen to new six-month lows.
At the obligatory press conference, expect Mario Draghi to highlight some of the downside potential inherent in a strong EUR (€1.2200) and the increased threats of a trade war.
Elsewhere, the Bank of Japan’s (BoJ) two-day policy meeting begins tomorrow; decision and forecasts are expected on Friday (April 27).
1. Stocks are on the back foot
In both Asia and Europe, equities have been tracking yesterday’s Wall Street decline.
In Japan, the Nikkei ended -0.3% lower, pressured mostly by Takeda Pharmaceutical stock plummeting -7% as investors fretted about the company’s ability to finance the Shire cash and stock deal. The broader TOPIX dropped -0.1%.
Down-under, Aussie shares rose overnight, driven by banks as benign inflation data backed expectations interest rates will remain accommodative for some time, but gains were capped by losses in materials on an extended slide in aluminum prices. The S&P/ASX 200 index ended up +0.6%, while in South Korea, the KOSPI fell for a fourth consecutive session.
In Hong Kong, equities followed the Asian market lower. The Hang Seng index fell -1.0%, while the China Enterprises Index lost -1.2%.
In China, stocks closed down on Wednesday as gains in healthcare firms were offset by losses in real estate and energy shares. Both the blue-chip CSI300 index and the Shanghai Composite Index fell -0.4%.
In Europe, regional indices trade lower across the board following on from a sharp drop on Wall Street and Asia.
US stocks are set to open in the ‘red’ (-0.4%).
Indices: STOXX 600 -0.80% at 379.9, FTSE 100 -0.5% at 7387, DAX -1.5% at 12353, CAC 40 -0.5 at 5419, IBEX 35 -0.7% at 9813, FTSE MIB -0.8% at 23854, SMI -0.6% at 8748, S&P 500 Futures -0.4%

2. Oil dips as rising US supply clouds bull-run, gold lower
Oil prices are under pressure ahead of the US open, falling back from their three-year highs reached Tuesday, as rising US fuel inventories and production weighed on market sentiment.
Brent crude oil futures are at +$73.71 per barrel, down -15c or -0.2%, from Tuesday’s close and almost -$1.8 below the November-2014 high of +$75.47 a barrel reached on Monday. US West Texas Intermediate (WTI) futures are down -12c, or -0.2% at +$67.58 a barrel.
The oil market has been lifted by supply cuts led by OPEC and the possibility of renewed US sanctions against Iran.
Note: The US has until May 12 to decide whether it will leave the Iran nuclear deal and re-impose sanctions against OPEC’s third-largest producer.
Market prices are being capped by US production – higher crude prices are bringing more US producers back “on line.”
Expect investors to take direction from this morning’s weekly EIA report (10:30 am EDT).
Gold prices are under pressure as US bond yields trade above the psychological +3% level, which has lifted the dollar to its highest in more than three-months. Spot gold is down -0.5% at +$1,323.59 per ounce, while US. gold futures has lost -0.6% to trade at +$1,325 per ounce.
Note: The yellow metal rallied +0.5% yesterday to break a three-session losing streak.
3. Yields remain near four-year highs
The US 10-year Treasury yield trades atop of its four-year highs.
Ahead of the US open, the yield on the 10-year note has backed up +2 bps to +3.02%. Higher US yields are supporting other G7 sovereign yields.
In Germany, the 10-year Bund yield has also climbed +2 bps to +0.65%, the highest in seven-weeks, while in the UK, the 10-year Gilt yield has gained +3 bps to +1.568%, the highest in two-months.
Note: The last time yields traded atop of current yield levels it hurt investor risk appetite and sent equities tumbling. It also came shortly before crude oil prices plummeted -75%.
The European Central Bank (ECB) guidance tomorrow (April 26), about the future of its stimulus programme, is the next thing that may cause some yield movement.
Last Friday, the ECB’s Draghi said he was confident that the inflation outlook has picked up, but uncertainties “warrant patience, persistence and prudence.”

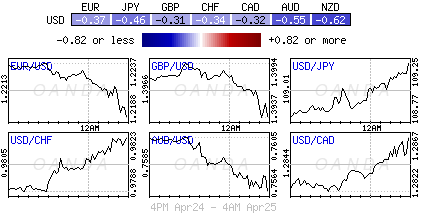
4. Dollar yields to higher rates
Withe the US 10-year yields trading above the psychological +3% is supporting the ‘big’ dollar for now.
EUR/USD (€1.2210) is still holding support at €1.2150, as investors wait to hear from the ECB tomorrow before making their next move. The ‘single unit’ could quickly fall to €1.2050 this week if the ECB disappoints tomorrow or if US GDP comes in on the firm side on Friday.
Note: Market participant have dialled back expectations that the ECB would wind up the QE program in September when the asset purchases currently are slated to end and no longer pricing in a summer 2019 rate rise, but rather looking toward the end of next year for the first hike.
GBP/USD (£1.3962) is little changed ahead of tomorrow’s House of Commons debate on the E.U Withdrawal Bill. The pound has seen little movement despite reports that the E.U is prepared to offer the U.K a better trade deal if it decides to stay inside the customs union after Brexit.
USD/JPY (¥109.03) is a tad higher for a sixth consecutive session.

5. Turkey’s Central Bank
The Turkish central bank is holding its monetary policy meeting this morning (07:00 am EDT) and the state lender is expected hike its top rate by +50 bps to +13.25%.
The techies believe that any inaction by the central bank could see the TRY ($4.0608) come under pressure again. USD/TRY is down by -0.65% at $4.0619 ahead of the announcement.