Monday July 31: Five things the markets are talking about
The ‘mighty’ U.S dollar starts the week trading with a bearish price action against the yen on repatriation flows as White House’s tensions with North Korea and Russia have escalated over the weekend.
Note: A North Korean missile launch showed that it might be within striking range of the U.S, while in Russia, President Putin has declared that he will kick out over 750 U.S diplomats by the end of September in retaliation to new sanctions. In Venezuela, at least nine killed, including a candidate, amid Venezuela protests during election for new legislative body that will reform constitution.
On the data front, there is a trifecta of central bank meetings with the Reserve Bank of Australia (RBA), Reserve Bank of India (RBI) and the Bank of England (BoE) all announcing their respective monetary policies (Aug 1, 2 and 3 respectively).
Elsewhere, the final July PMI’s will be released for a host of countries, while trade data will be reported for Australia, Canada and the U.S.
Finally, ending another week of heavy earnings reports will be Friday’s July employment data for the U.S and Canada.
1. Stocks get the green light for now
Year-to-date, equities have rallied to record levels globally on evidence of a resilient worldwide economy.
In Japan, the Nikkei ended slightly softer overnight (-0.2%), trading atop of its seven week lows as a sell-off in index heavyweight stocks offset gains in companies with upbeat earnings. For the month, the Nikkei has lost -0.5%, snapping a three-month winning streak. The broader Topix index closed -0.2% lower after swinging between gains and losses.
Down-under, Australia’s S&P/ASX 200 Index rallied +0.3%, while South Korea’s KOSPI index added +0.1%.
In Hong Kong, the Hang Seng Index added +1.3% with financials among the biggest contributors to the advance. The index has completed a seventh-straight month of gains – For July, HSI was up +6.1%.
In China, stocks extended their gains, aided by earnings outlooks at resource firms. The blue-chip CSI300 index rallied +0.5%, while the Shanghai Composite Index added +0.6%, it’s highest since mid-April. For the month, CSI 300 advanced +2.0%, while SSEC gained +2.5%.
In Europe, regional indices trade higher across the board with outperformance in the Swiss SMI and FTSE 100 mostly buoyed by financials. It will be another busy week for earnings.
U.S stocks are set to open flat.
Indices: Stoxx600 +0.2% at 379, FTSE +0.4% at 7398, DAX flat at 12164, CAC 40 -0.1% at 5126, IBEX 35 +0.1% at 10550, FTSE MIB +0.3% at 21496, SMI +0.4% at 9055, S&P 500 Futures flat at 2471

2. Oil hits new high on tighter U.S market, Venezuela sanctions risk
Overnight, oil prices hit a two-month high, lifted by a tightening U.S crude market and the threat of sanctions against OPEC-member Venezuela.
Brent crude futures are at +$52.85 per barrel, up +33c or +0.6%, while U.S. West Texas Intermediate (WTI) futures briefly jumped over +$50 per barrel, up +25c, or +0.5% from Friday’s close.
Note: The price rises put both crude benchmarks on track for a sixth consecutive session of gains and up +10% since the last meeting of OPEC and other major producers.
U.S crude inventories have fallen by -10% from their March peaks to +483.4m barrels, while production numbers indicate that U.S output has dipped by -0.2% to +9.41m bpd in the week to July 21, after rising by more than +10% since mid-2016.
Drilling for new U.S production is also slowing, with just 10 rigs added in July, the fewest since May 2016.
Note: Despite the signs of a tighter market stateside, supplies in China remain plentiful – June crude inventories rose to the highest level in 11-months, marking the third month of gains.
Gold prices are trading atop/near its seven-week high overnight (-0.2% to +$1,267.07 an ounce) as tensions on the Korean peninsula boosted safe-haven demand for the precious metal – It gained +1.1% last week in what was its third consecutive weekly gain.
Silver also rallied +1.2% last week, its third straight weekly gain, while copper climbed +1.2% to +$2.91 a pound, its highest price in more than two-years.

3. Global yields little changed
U.S government-bond prices rallied Friday after domestic data showed economic growth picked up in Q2 (+2.6% vs. +2.7%e), but that inflation continues to remain somewhat tepid.
U.S Q2 GDP rose at a +2.6% annual rate vs. the +2.7% expected, while the U.S employment-cost index (a broad gauge of wages and benefits), advanced by a seasonally adjusted +0.5% in Q2, less than the +0.6% rate the market was expecting.
The yield on benchmark 10’s settled at +2.29%, down -2 bps from Thursday’s close. However, it was still the first weekly gain for bond yields since July 7.
Elsewhere, Germany's 10-Year Bund yield has declined -1 bps to +0.54%, UK 10-Year Gilts have also fallen -1 bps to +1.21%.

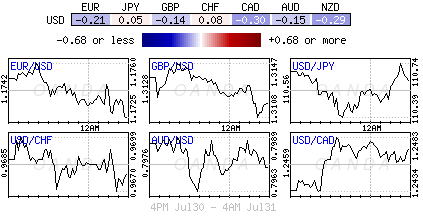
4. Is the Dollar undervalued?
U.S political uncertainty surrounding the Trump administration has pressured the mighty USD, down -9% against the majors year-to-date.
Based on U.S fundamentals, is the dollar too much undervalued? Data for leveraged funds indicated that they are holding net ‘short’ dollar positions for the first time since May 2016.
The weakness in the world’s reserve currency comes despite the Fed hiking rates last month, the prospect of further increases, and the shrinking of the Fed’s balance sheet “relatively soon”. The market is also expecting a tightening soon bias from a plethora of other central banks (ECB, BoE, BoC and RBA). Maybe it’s time to consider lightening up on the sell the Trump dollar trade?
This morning, the EUR (€1.1733) has managed to pare some of its losses outright after in-line eurozone headline CPI inflation data, above-forecast core CPI data and better-than-expected jobless data (see below). It’s now trading down -0.1% ahead of the U.S open.
GBP/USD is fractionally lower at £1.3110 with market focus on the BoE rate decision this Thursday.

5. Eurozone jobless rate falls, inflation stalls
Data this morning showed that the Eurozone’s annual rate of inflation for July was as expected at +1.3%, unchanged m/m and remains at the lowest level for this year. The core rate nudged up to +1.2% despite a slowing of service prices, but all measures remain well below the ECB’s target of just under +2%.
Causing further frustration for Euro policy makers is the unemployment rate continues to fall quite quickly – it’s down to +9.1% in June, its lowest level in eight-years. The May rate was revised lower from 9.3% to 9.2%.
Overnight, China July Manufacturing PMI (Government Official) misses expectations, but expands for the 12th straight month.
China July official manufacturing PMI came in at 51.4 vs. 51.5e, and non-manufacturing PMI at 54.5 also shy of expectations.
Digging deeper, sub-component for construction rose to a high not seen since Dec 2013.