The lack of any clear macroeconomic drivers has kept the markets broadly subdued. Investors sold off the US dollar as the proposed tax reforms were rumored to be delayed. The US Senate Republican plan for delaying the corporate tax cuts to 2019 saw even the equities falling back.
On the economic front, the EU commission’s economic forecasts were upbeat on GDP as the commission said that GDP would rise at the fastest pace in nearly a decade. The euro managed to recover on the back of the positive assessment. The RBA lowered its inflation forecasts noting that inflation might not reach the lower end of the 2% band until 2019.
Looking ahead, the UK's manufacturing, construction and industrial production numbers will be coming out today. The economic calendar is light. Later in the afternoon, the UoM's consumer sentiment and inflation expectations data will be released.
EUR/USD Intraday Analysis

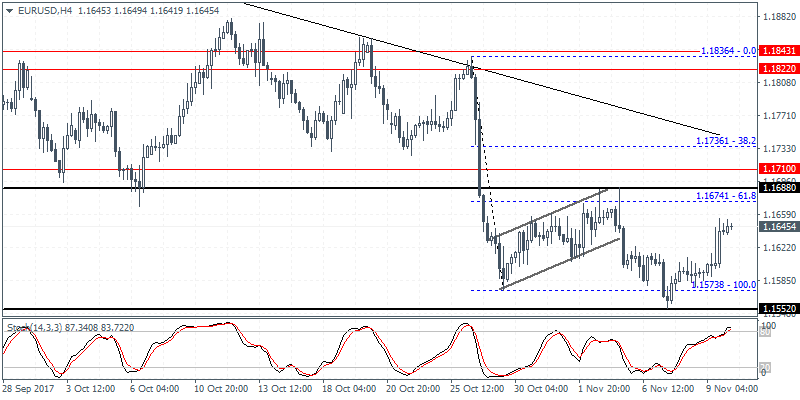
The EUR/USD maintained its bullish gains yesterday marking a second consecutive day of gains. Price action rallied to a four-day high yesterday but remained well below the 1.1674 resistance level. The bearish flag pattern breakout level is being retested, but the strong bounce off the previous low suggests that the bearish pattern might be weakening. On the 4-hour chart, however, we see some bearish signs with the Stochastics oscillator posting a hidden bearish divergence. Thiscould possibly suggest another leg to the downside if EUR/USD posts a reversal at the current levels. Overall, the ranging price action between 1.1688 - 1.1574 is most likely to be maintained.
USD/JPY Intraday Analysis

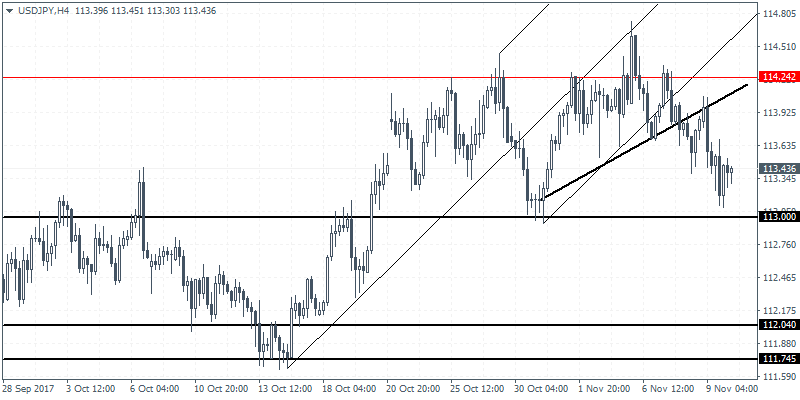
The USD/JPY was seen breaking past the minor trendline. On the daily chart, the breakout from the rising wedge pattern potentially indicates the downside decline in prices. Support at 113.00 is likely to be tested in the near term. A break down below 113.00 support could, however, push USD/JPY lower towards the next support level at 112.04 - 111.74 area of support. A short-term bounce to the upside could see prices rising back to the breakout level, but the bias remains poised to the downside. The bearish outlook changes only on a close above 114.24.
XAU/USD Intraday Analysis

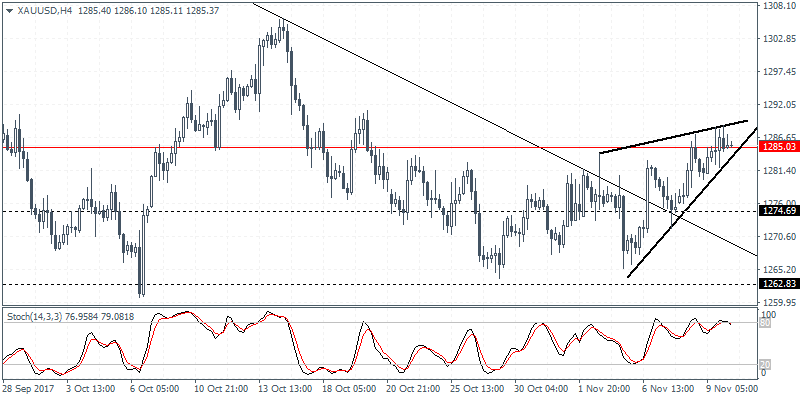
Gold prices managed to rally back to the 1285 level of resistance yesterday. The subdued price action within 1285 resistance and 1262 support could be seen breaking out in the near term. However, theprice needs to close above 1285 in order to maintain the bullish bias towards the 1320 level of resistance. Given the strong consolidation at the 1285 handle, we expect the possibility of a fake break out near this level, which could potentially trap weak long positions. The minor rising wedge pattern near the resistance level indicates a possible decline back to 1274.70 where price could retest the breakout level from the trend line.
