Here are the latest developments in global markets:
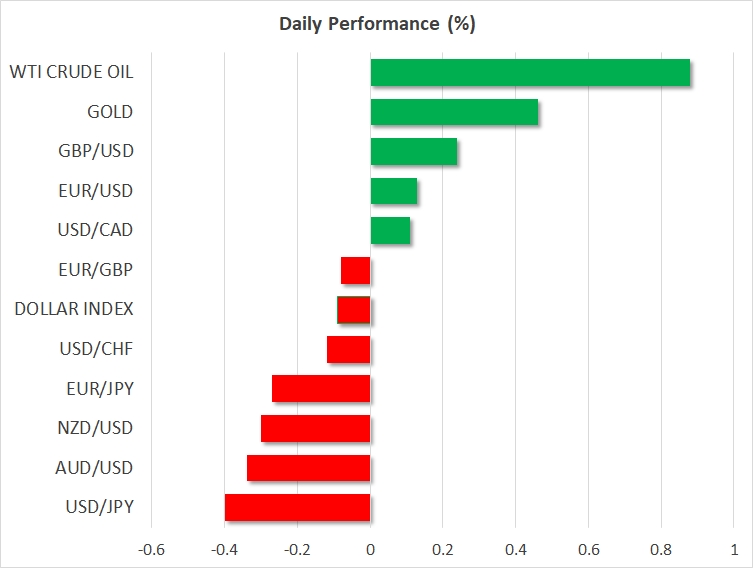
· FOREX: The US dollar index was marginally lower on Wednesday's Asian session, experiencing little movement in the session, as investors’ attention remained fixed on movements in stock markets.
· STOCKS: US equity indices rebounded yesterday, temporarily alleviating some concerns that the sell-off seen earlier in the week would develop into something much bigger.
The Dow Jones led the way, gaining an extraordinary 2.3%, while the NASDAQ Composite followed in its tracks, up by 2.1%. The S&P 500 rose 1.7%.
the Dow and S&P experienced their best daily performance since January 2016 and November 2016 respectively, while the NASDAQ climbed the most since October of last year. However, futures tracking the Dow, S&P and the Nasdaq 100 are all currently in negative territory, suggesting that the recent volatility in stocks may not be over just yet.
Japanese markets recovered today as well, but to a much smaller degree. The Nikkei 225 closed higher by only 0.2%, while the TOPIX gained 0.4%. The underperformance of Japanese indices may be owed to the recent safe-haven gains in the yen, as a stronger Japanese currency typically weighs on the profits of Japanese exporting firms.
Turning to Europe, futures tracking the Euro Stoxx 50 are currently up 1.2%, signaling that the rebound in the US may roll over into European trading too.
· COMMODITIES: Oil prices recovered as well, with WTI and Brent crude being up 0.9% and 0.8% respectively.
The modest rebound in oil prices was helped by the private API inventory data released overnight, which showed a drawdown in US stockpiles.
Today, investors will turn their eyes to the official EIA inventory data – due at 1530 GMT (1030 EST). It will be interesting to see whether the recent surge in US oil rigs has started to translate into higher production.
In precious metals, gold was up nearly 0.5%, as the broader market volatility heightened demand for the safe-haven asset.
Major movers: U.S. stocks rebound; Kiwi dollar jumps ahead of RBNZ decision
Investors remained focused on US equity markets yesterday. After a very volatile session, the major US indices managed to assume a direction and close the day notably higher, recovering some of the losses they posted on Monday. Despite this rebound though, the turmoil may not be over yet, as futures tracking the major US indices are flashing red today.
Nonetheless, the fact that US markets closed positive yesterday is another factor reinforcing the argument that the recent tumble appears to be merely a correction following years of robust gains, and not the beginning of a bear market.
Nothing major has changed fundamentally, with economic data and surveys confirming that the major economies are still on a very strong footing.
NZD/USD jumped overnight, following the release of New Zealand’s employment report for the fourth quarter, which was stronger than expected overall. Even though wages rose at the same pace as previously, the unemployment rate surprisingly fell, while the labor force participation rate rose by more than anticipated, showing that the nation’s labor market continues to tighten at a rapid pace.
Despite the initial positive reaction in NZD/USD, the pair did not manage to maintain its upward momentum and gave back most of its gains in the following hours. A potential explanation for the pullback may be investors’ jitters ahead of the RBNZ policy decision later today, at 2000 GMT (1500 EST).
Although the central bank is likely to maintain a relatively neutral tone on policy amid mixed economic data (disappointing inflation, but strong labor market), it could toughen its language around the NZD, which has surged since the last meeting. Thus, investors may have opted to take some profits off the table ahead of the risk event and liquidate some of their long-NZD exposure.
Day ahead: RBNZ rate decision on horizon; German politics eyed
The economic calendar is relatively light on Wednesday, with the Reserve Bank of New Zealand’s (RBNZ) interest rate decision attracting attention later in the day, while any developments on the German political front could also lead to investor positioning.
At 0830 GMT (0330 EST), the Halifax House Price Index for the month of January is due out of the UK. The measure is expected to show an increase in prices by 0.2% on a monthly basis after December’s decline by 0.6%.
From North America, Canada will see the release of figures on December’s building permits at 1330 GMT (0830 EST), while US consumer credit data for the month of December are scheduled for release at 2000 GMT (1500 EST).
Back to the RBNZ's rate decision, no change in policy is expected, with the official cash rate remaining unchanged at the record low of 1.75%. It would be interesting to see if policymakers attempt to talk down the currency following its recent gains.
In politics, discussions continue between German Chancellor Angela Merkel’s conservative bloc and the Social Democrats in an effort to strike a deal, forming a government and reviving their “grand coalition”.
In terms of policymakers’ appearances: ECB board member Sabine Lautenschlager and bank supervisory chief Daniele Nouy will be holding a news conference at 0900 GMT (0400 EST).
Fed Bank of Dallas President Robert Kaplan – a non-voting FOMC member in 2018 – will be participating in a Q&A session in Frankfurt at 1100 GMT (0600 EST). New York Fed President William Dudley will be participating in a discussion titled “Banking Culture: Still Room for Improvement?” at 1330 GMT (0830 EST) – the NY Fed chair holds a permanent voting status within the FOMC.
And Chicago Fed President Charles Evans – a non-voting FOMC member in 2018 – will be talking on US current economic conditions and monetary policy before the Iowa Bankers Association Bank Management Conference.
Oil prices could experience volatility when the Energy Information Administration (EIA) releases its report including information on US crude and gasoline stocks for the week ending February 2 at 1530 GMT (1030 EST).
Crude inventories are projected to post their second straight week of rises after declining in the 10 previous weeks. Specifically, analysts anticipate an increase by 3.3 million barrels. This compares to a rise by around 6.8m barrels in the week that preceded.
In stock markets, quarterly earnings releases by corporations will continue to draw investor interest; electric vehicle-maker Tesla (NASDAQ:TSLA) and Twenty-First Century Fox (NASDAQ:FOX) will be among companies releasing results on Wednesday.
Technical Analysis: WTI oil futures retreat from 3-year high; bearish signal by stochastics in very short-term
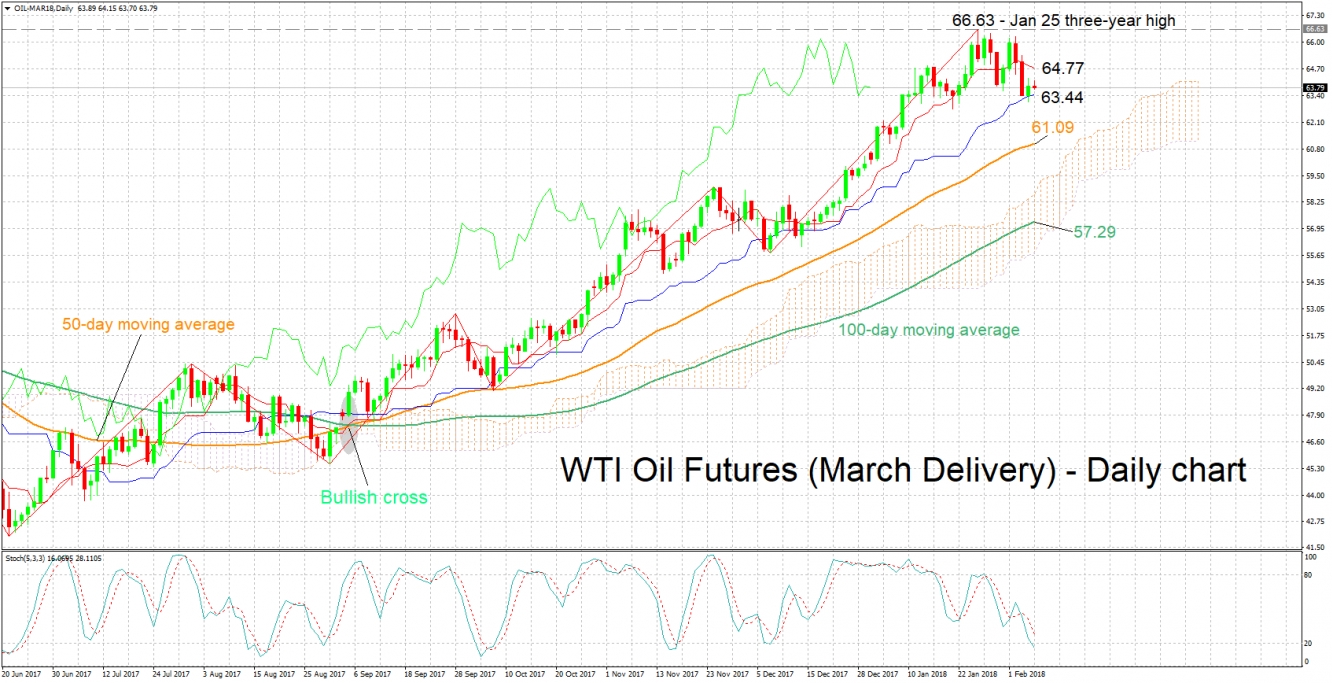
WTI oil futures for March delivery have retreated a bit after hitting a more than three-year high of 66.63 on January 25. The Tenkan-sen line remains above the Kijun-sen, continuing to project a bullish picture in the short-term.
However, the stochastics are giving a bearish signal in the very short-term as the %K line has crossed below the slow %D line and both lines are heading lower.
If the EIA weekly report shows a smaller-than-forecasted increase in crude stocks – or a drawdown of course – oil prices could head higher. In this case, resistance could come around the current level of the Tenkan-sen at 64.77. Stronger bullish movement would shift the focus to the late January high of 66.63.
Should crude inventories rise by more than projected however, then prices could weaken. In this scenario, the area around the Kijun-sen at 63.44 might provide support. Notice that price action is currently taking place not far above this level. A downside violation would turn the attention to the current level of the 50-day moving average at 61.09.


