Monday January 15: Five things the markets are talking about
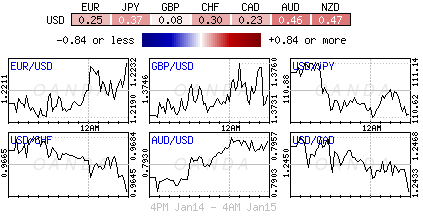
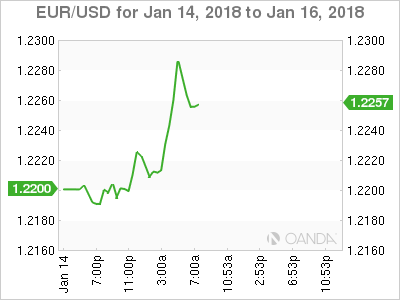
The U.S. dollar is in trouble and is heading for a fourth day of losses against G10 currency pairs on rate differentials, while euro equities are under pressure as the region’s ‘single’ currency (€1.2260) rallies to its strongest position in more than three-years outright.
Last Friday’s December U.S. CPI report should go some ways to provide some reassurance to the Fed that domestic inflation is likely to rise towards their target over time, however, both U.S policy makers and the market will most likely require more convincing that firmer inflation can be sustained and reason why the U.S. currency starts this week on the back foot.
On the agenda for this week, the Bank of Canada’s (BoC) interest-rate decision comes Wednesday (10 am EDT), while monetary policy announcements are also due in South Korea, South Africa and Turkey.
Stateside, industrial production (IP) probably increased last month, a report may show Wednesday, completing a solid year for manufacturing, while U.S housing starts Thursday is expected to have slipped in December for the first time in three-months as cold weather impeded work.
Elsewhere, China releases Q4 GDP, December industrial production and retail sales on Thursday.
Note: U.S. markets are closed Monday for the Martin Luther King Jr. holiday.
1. Stocks mixed results
In Japan, the Nikkei share average tracked a rise in global equities and advanced overnight, although the dollar’s (¥110.62) weakening against the yen capped gains. The Nikkei ended +0.26% higher, while the broader Topix added +0.4%.
Down-under, the ‘big’ miners helped keep Australia’s equity market in the green overnight. By day’s end, the S&P/ASX 200 inched up +0.1% for a second consecutive session, as energy, tech and telecom shares weighed.
In Hong Kong, stocks snapped a 14-day winning streak, dragged down by a retreat in property shares and index heavyweight Tencent Holdings. At the close, the Hang Seng index was down -0.23%, while the Hang Seng China Enterprises index rose +0.01%.
In China, equities snapped an 11-session winning streak, with gains in banking and real estate firms offset by resources and industrial shares. The Shanghai Composite index was down -0.55%, while the blue-chip CSI300 index was flat.
In Europe, regional indices trade mostly lower in quieter trade, as U.S cash markets remain closed in observance of Martin Luther King. News flows have been relatively quiet ahead of a busier corporate schedule for the week ahead.
Indices: STOXX 600 -0.2% at 397.80, FTSE flat at 7776, DAX -0.3% at 13208, CAC 40 -0.2% at 5504, IBEX 35 flat at 10466, FTSE MIB -0.2% at 23397, SMI -0.1 at 9542, S&P 500 Futures +0.2%
2. Oil hovers near highs, clouded by rise in U.S. output, gold rallies
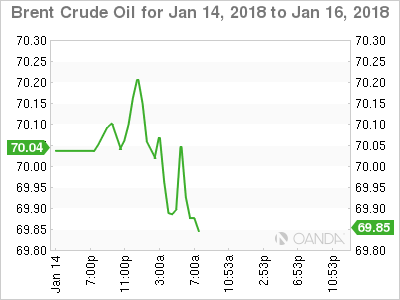
Oil hovered below a three-year high near $70 a barrel on Monday on signs that production cuts by OPEC and Russia are tightening supplies, but analysts warned of “red flags” due to surging U.S. production.
Brent crude futures are trading -18c lower at +$69.69, after having risen above +$70 earlier in the session. U.S West Texas Intermediate (WTI) crude futures are at +$64.22, down -8 cents from Friday’s close.
A production-cutting pact between the OPEC, Russia and other producers has given a strong tailwind to oil prices, with both benchmarks last week hitting levels not seen in three-years.
Growing signs of a tightening market has boosted confidence among traders and analysts that prices can be sustained near current levels. Other factors, including political risk, have also supported crude.
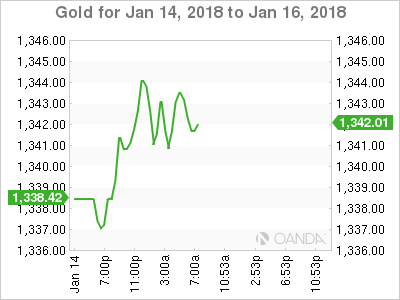
Gold prices hit a four-month high as the dollar index slumped to a three-year low. Spot gold is up +0.1% at +$1,339.46 an ounce, after earlier touching its strongest since September at +$1,339.97.
Note: Spot gold rose for a fifth consecutive straight week last week, gaining +1.4%.
3. Sovereign yields try to back up
Friday’s U.S. inflation data showing that the underlying pace of U.S. inflation accelerated last month finally drove the U.S. two-year benchmark yield above +2%, as traders priced in a growing likelihood that the Fed would follow through on its projection of three-rate increases this year.
Note: Along the U.S curve, Treasuries fell broadly, led by shorter maturities, with the difference between yields on five- and 30-year maturities approaching the tightest spread in 10-years.
Elsewhere, the rise in bond yields over the past fortnight has pushed the yield of Germany’s 30-year benchmark bund to around +1.30%, which should help demand at Wednesday’s German long Bund auction.
Note: On the negative side, the volume of Germany’s 30-year debt issuance will be higher this year than in 2017, with planned volume at +€16B vs. +€11B last year.
Elsewhere, in the U.K, the 10-year yield declined -1 bps to +1.339%, the first retreat in a week and the largest decrease in more than a week.
4. Sterling highest vs. dollar since Brexit
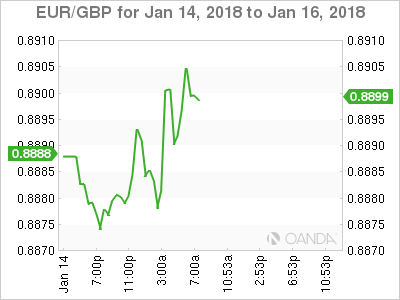
Even though Carillion PLC (UK’s second biggest construction company) goes into liquidation this morning, currently there is no other bad news capable of pushing the pound down and with the USD falling across the board, GBP/USD has reached its highest since the Brexit vote, rising +0.5% to £1.3809.
Note: Tomorrow’s UK inflation data could see the market firm up expectations for a May hike (CPI and PPI at 04:30 am EDT).
The EUR (€1.2286) continues to shine as the dollar loses more ground, lifting the ‘single’ currency to another three-year high. Despite the dollar’s weakness, there are a number of reasons supporting the ‘single’ currency – positive political developments in Germany, a “more-hawkish-than-expected” ECB, an exceptionally strong eurozone economic data and ongoing ‘undervaluation’ have led investors to favor the EUR outright.
5. Euro area international trade
Data this morning showed that the first estimate for Euro region (EA19) exports of goods to the rest of the world in November 2017 was +€197.5B, an increase of +7.7% compared with November 2016 (+€183.5B).
Imports from the rest of the world stood at +€171.2B a rise of +7.3% compared with November 2016 (+€159.6B).
As a result, the Euroarea recorded a +€26.3B “surplus” in trade in goods with the rest of the world in November 2017, compared with +€23.8B in November 2016.
Intra-euro area trade rose to +€165.5B in November 2017, up by +6.9% compared with November 2016.
