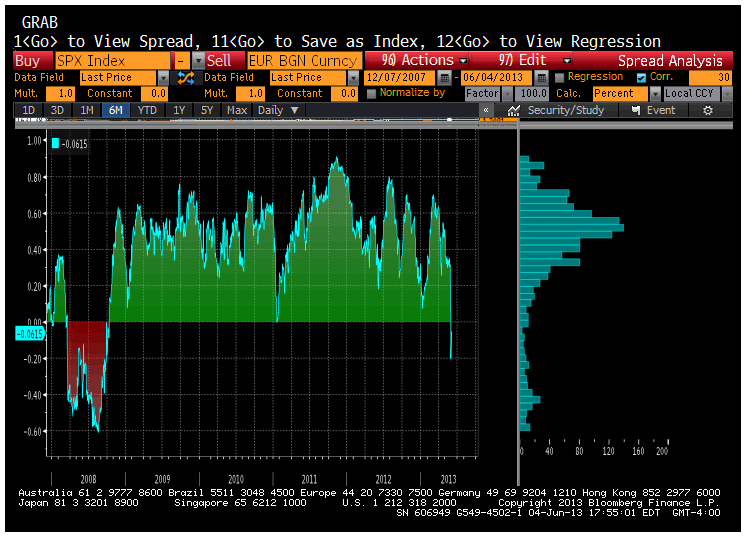
This Great Graphic depicts a shift in correlations between the euro-dollar exchange rate and the S&P 500.
The first chart is the results of a correlation conducted on the percentage change of the euro and the percentage change in the S&P 500 on a rolling 30-day basis. As investors, we are most interested in the correlation of returns.
While we prefer a 60 day rolling correlation, the market appears to have entered a new phase last month. We know that the reach for yield reversed in May and what was heralded as a "trade of the century" (short yen and long the Nikkei) was quite frustrating.
While recognizing that the correlation study could be more robust, it is suggesting a potential change in the relationship. As the chart shows, the correlation of the euro and S&P returns has broken down and is now inverse for the first time in several years. The 60-day correlation has not turned negative, but it has been trending lower and tested the lower end of where it has been since the crisis in late May, dipping below 0.25.
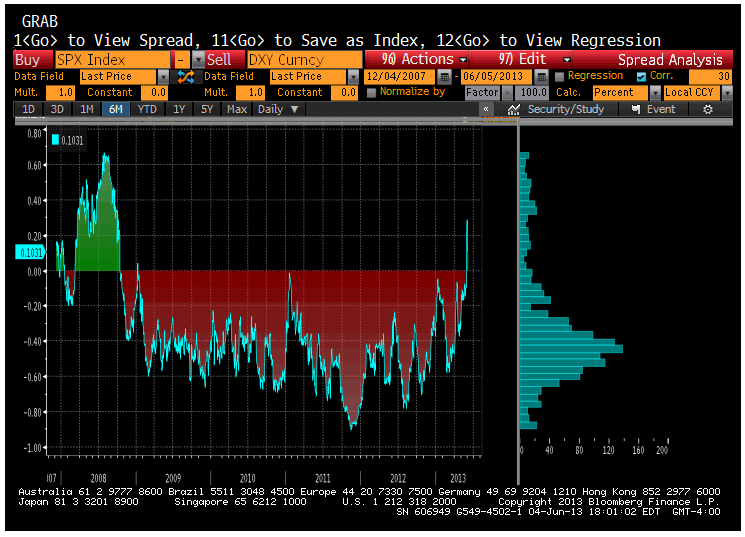
This second chart shows the results of a similar correlation exercise, but instead of the euro, we used the Dollar Index. There is a big overlap between the two because the composition of the Dollar Index is heavily weighted toward the euro and currencies that move in the euro's orbit, like the Swiss franc, British pound and Swedish krona. Together they make up 77.3% of the Dollar Index.
The remaining 22.7% consists of the yen and the Canadian dollar. It is not representative of US trade. Two of the US's largest trading partners, Mexico and China, are not even included. Nevertheless it is a popular reference point and speculative vehicle, with some ETFs, like PowerShares DB US Dollar Index Bullish Fund (UUP) and PowerShares DB US Dollar Index Bearish (UDN) (which together have about $800 mln market cap or AUM) based on it. 
The correlation of the percent change in the Dollar Index and the percent change in the S&P 500 has swung positive for the first time in year on a 30-day rolling basis. Again this is preliminary and not confirmed (yet?) on a 60-day basis. The 60-day correlation is still inverse but near -0.12, which is the least inversion since the Lehman debacle.
We see this as a yellow flag: Be warned that a significant shift may be underway and that investors should monitor these developments closely in the period ahead.
- English (UK)
- English (India)
- English (Canada)
- English (Australia)
- English (South Africa)
- English (Philippines)
- English (Nigeria)
- Deutsch
- Español (España)
- Español (México)
- Français
- Italiano
- Nederlands
- Português (Portugal)
- Polski
- Português (Brasil)
- Русский
- Türkçe
- العربية
- Ελληνικά
- Svenska
- Suomi
- עברית
- 日本語
- 한국어
- 简体中文
- 繁體中文
- Bahasa Indonesia
- Bahasa Melayu
- ไทย
- Tiếng Việt
- हिंदी
Dollar And Stocks: Shifting Correlations?
Published 06/05/2013, 12:11 AM
Updated 07/09/2023, 06:31 AM
Dollar And Stocks: Shifting Correlations?
3rd party Ad. Not an offer or recommendation by Investing.com. See disclosure here or
remove ads
.
Latest comments
very interesting article indeed! Thank you...i knew i wasn't crazy thinking the markets are acting very strange as if there is a shift about to happen!
Install Our App
Risk Disclosure: Trading in financial instruments and/or cryptocurrencies involves high risks including the risk of losing some, or all, of your investment amount, and may not be suitable for all investors. Prices of cryptocurrencies are extremely volatile and may be affected by external factors such as financial, regulatory or political events. Trading on margin increases the financial risks.
Before deciding to trade in financial instrument or cryptocurrencies you should be fully informed of the risks and costs associated with trading the financial markets, carefully consider your investment objectives, level of experience, and risk appetite, and seek professional advice where needed.
Fusion Media would like to remind you that the data contained in this website is not necessarily real-time nor accurate. The data and prices on the website are not necessarily provided by any market or exchange, but may be provided by market makers, and so prices may not be accurate and may differ from the actual price at any given market, meaning prices are indicative and not appropriate for trading purposes. Fusion Media and any provider of the data contained in this website will not accept liability for any loss or damage as a result of your trading, or your reliance on the information contained within this website.
It is prohibited to use, store, reproduce, display, modify, transmit or distribute the data contained in this website without the explicit prior written permission of Fusion Media and/or the data provider. All intellectual property rights are reserved by the providers and/or the exchange providing the data contained in this website.
Fusion Media may be compensated by the advertisers that appear on the website, based on your interaction with the advertisements or advertisers.
© 2007-2024 - Fusion Media Limited. All Rights Reserved.
