Here are the latest developments in global markets:
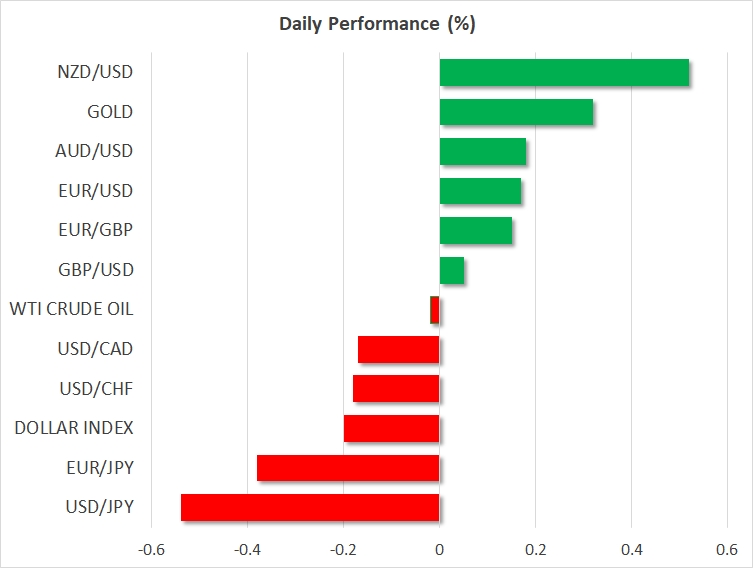
· FOREX: The dollar index traded 0.2% lower on Wednesday, ahead of key US inflation and retail sales data releases that could determine the currency’s short-term direction.
· STOCKS: US markets closed with modest gains on Tuesday, with investors appearing hesitant to take up large positions ahead of the US inflation data today, which could determine whether the recent turmoil will intensify or subside. The NASDAQ Composite was the leader of the pack, rising by almost 0.5%. The S&P 500 and the Dow Jones gained nearly 0.3% and 0.2% respectively.
At the time of writing, futures tracking the S&P, Dow, and the NASDAQ 100 are all in the green. In Asia, Japan’s Nikkei 225 and TOPIX fell by 0.4% and 0.8% respectively – the latter recording a four-month low – but in Hong Kong, the Hang Seng was up by a remarkable 1.8%. Turning to Europe, futures tracking all the major equity indices are in positive territory, signaling they could open higher today.
· COMMODITIES: Oil prices were nearly unchanged on Wednesday, after posting modest losses yesterday. The sentiment surrounding the energy market remains quite fragile. While the tentative recovery in stocks is supporting risk appetite and energy prices, the fundamentals of the oil market are showing signs of deterioration, as US production is increasing at a very rapid pace. In this respect, oil traders will look to the release of the weekly EIA inventory data today at 1530 GMT for fresh clues as to whether US oil output continued to surge in the previous week.
In precious metals, gold is 0.3% higher today, boosted by the fall in the US dollar and perhaps the broader aversion to risk.
Major movers: Dollar drops ahead of critical inflation data; kiwi jumps
The US dollar came under renewed selling interest yesterday, with USD/JPY sinking to touch the 106.80 zone before rebounding, a low last seen in November 2016. While there was no clear catalyst behind the dollar’s drop, the move may be owed to positioning shifts (i.e. trimming long USD positions) ahead of today’s all-important US inflation figures for January.
It is safe to say that these prints – and particularly the core CPI – will probably determine the near-term direction of both the dollar and US equity indices.
Let’s not forget that the narrative behind this broader equity turmoil is that a surge in US inflation is just around the corner, and that the Fed may have to respond by raising rates aggressively. Investors will be looking at the CPI data to either confirm or disprove that.
In a sense, it’s all about the bond market and yields today. Stronger-than-anticipated CPIs would probably push the yields on US Treasuries higher, which would be good news for the dollar, but bad news for equities, which see their demand diminish as yields move higher and higher.
On the contrary, a softer inflation report than what is projected would mean that the Fed does not need to accelerate its normalization pace, something likely to push yields and the dollar lower, but provide some much-needed relief to stock indices.
In the UK, CPI data for January released yesterday showed that core inflation accelerated by more than expected, raising bets that the Bank of England (BoE) may have to respond with faster rates hikes. The pound surged on the news, but gave back its gains in the following minutes. Following the hawkish signals at last week’s BoE meeting and this set of data, markets have priced in a 65% probability for a rate hike in May, according to the UK overnight index swaps.
Overnight, USD/NZD surged following the release of the RBNZ’s updated 2-year inflation expectations print, which rose to 2.11% from 2.02% previously. This is a particularly encouraging sign for the RBNZ, which pays close attention to this indicator (in fact, a drop in this print was the key reason for the rate cuts back in early 2016). The fact that inflation expectations rose even though the actual CPI rate fell in the fourth quarter signifies that expectations remain well-anchored near the 2% mark, and increases the likelihood for a more optimistic tone by the Bank moving forward.
Day ahead: Riksbank, eurozone GDP and US inflation & retail sales on the horizon
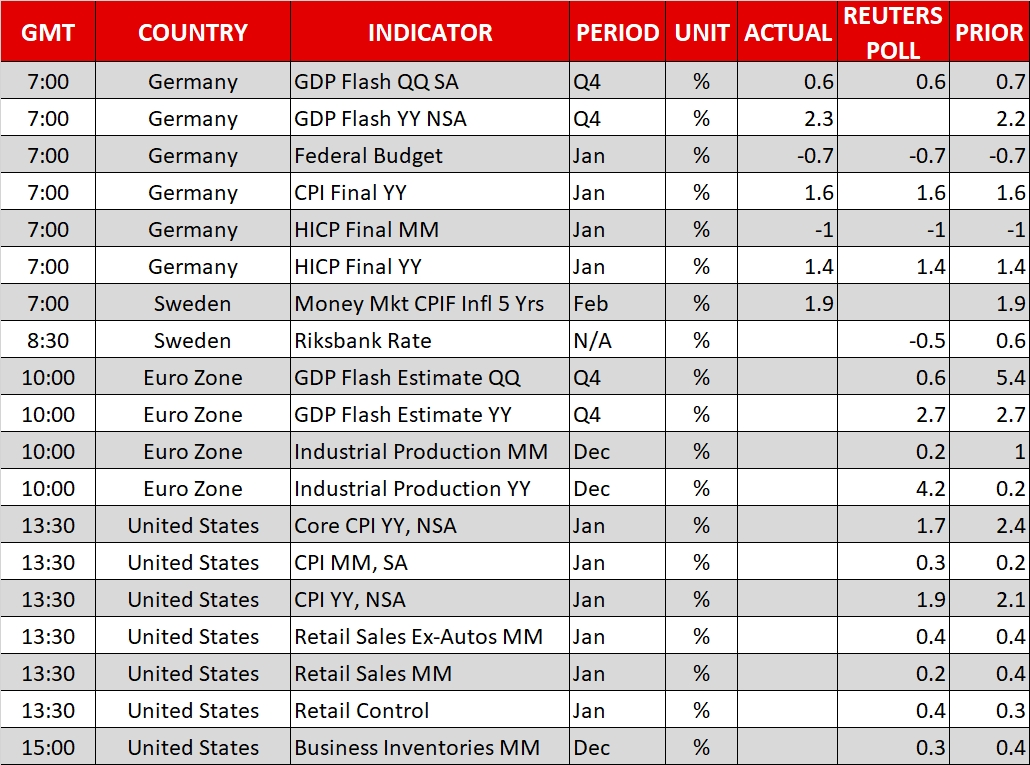
The Riksbank will be completing it two-day meeting on monetary policy later today, with the decision on interest rates being made public at 0830 GMT; the Riksbank rate is anticipated to be maintained at -0.50%. The Governor of the Swedish central bank, Stefan Ingves, and the head of the Bank’s monetary policy department, Jesper Hansson, will be holding a press conference at 1000 GMT. Krona pairs will be in focus.
At 1000 GMT, the eurozone will see the second release of Q4 2017 GDP growth. Quarter-on-quarter, the pace of expansion is anticipated at 0.6%, the same as in the first release and below Q3’s respective figure of 0.7%, while annualized growth is projected to come in at 2.7%, in line with the first release and again below Q3’s respective figure of 2.8%, a rate of growth last achieved in Q1 2011. Data on eurozone industrial production for the month of December will be released at the same time.
The much-talked about inflation figures out of the US are due at 1330 GMT. There are rising inflation expectations as of late in the US, and today’s CPI figures could show – a least to an extent – whether those are justified.
January’s headline CPI is projected to grow at a stronger pace on a monthly basis, while on an annual basis it is expected at 1.9%, below December’s 2.1%. Annually, core inflation is also anticipated to tick lower, with analysts projecting it at 1.7% versus December’s 1.8%. The Federal Reserve’s preferred inflation measure is the core personal consumption expenditure (PCE) index, but still forex market participants will be paying attention to the data as they can give insights on the speed with which the US central bank will continue to tighten its policy.
January’s retail sales, released alongside CPI numbers (1330 GMT) will also be attracting interest in the US. Those exhibited positive momentum in the few previous months and are expected to have increased for the fifth consecutive month in January. Other releases out of the world’s largest economy include data on December business inventories due at 1500 GMT.
Oil traders will be paying attention to the Energy Information Administration’s (EIA) report including information on US crude and gasoline stocks for the week ending February 9 at 1530 GMT. Crude inventories are projected to rise for the third straight week after declining in the 10 that preceded. Specifically, analysts anticipate an increase by around 2.8 million barrels. This compares to a rise by around 1.9m barrels during the previously tracked week.
TripAdvisor (NASDAQ:TRIP) will be among companies releasing quarterly results on Wednesday.
Technical Analysis: WTI oil futures trade close to 2-month low; looking bearish to neutral in short-term
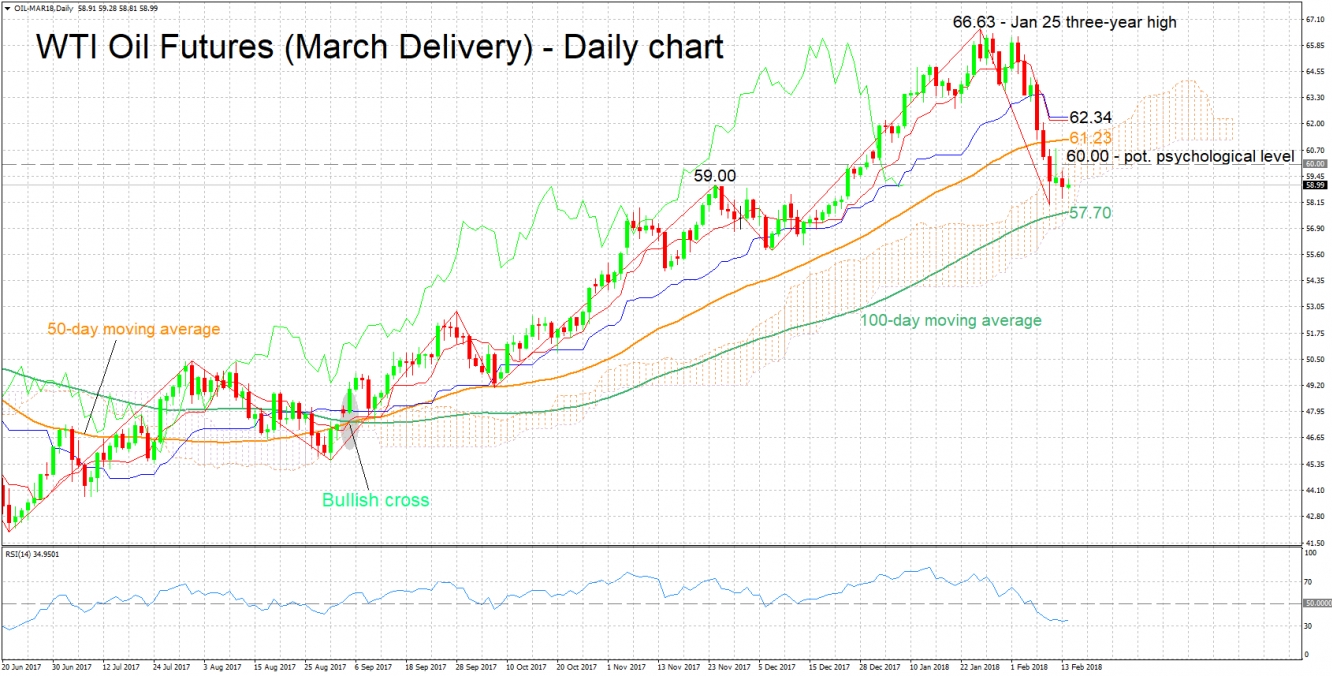
WTI futures for March delivery are currently trading not far above the two-month low of 58.05 hit last Friday. The short-term bias is looking bearish to neutral: The Tenkan-sen line is below the Kijun-sen, though the two lines have flatlined, suggesting that downside pressure has eased. Adding to this, the RSI has halted its decline and has been moving sideways in recent days.
If the Energy Information Administration’s weekly report shows a smaller-than-anticipated increase in US crude oil inventories, oil prices could head higher. In this case, resistance could come around the 60 handle, this being a level of potential psychological significance. Prices could be meeting a barrier around the 59.00 level at the moment; the area around this point encapsulates a peak from the recent past.
On the other hand, should crude inventories rise by more than projected, then prices could weaken. In this scenario, the area around the current level of the 100-day moving average at 57.70 might provide support. The range around this point includes last week’s low of 58.05, as well as the Ichimoku cloud bottom at 57.67.


