This is Part II of a two-part article. To read Part 1: Oil, Gold, USD, China And Contrarian Bets, click here.
Though it's difficult to pinpoint what specifically might have been the biggest market story of 2015, it's clear that the collapse of the commodity sector—oil's 35% decline in particular—was at the forefront of everyone's list of concerns. The strong US dollar was another culprit. Though it benefited some retailers, it wreaked havoc on many emerging market economies including Russia, Turkey, Brazil and South Africa.
And then of course there's China: Its economy, most analysts agree, is slowing and undergoing a major shift away from manufacturing, toward services. The country's Shanghai Index had a roller coaster year, skyrocketing up into the summer months, then rapidly down as the fall months began. The PBoC had been devaluing the yuan in small increments throughout the year in an effort to make the currency acceptable for inclusion in the IMF's SDR basket of key currencies, but on August 12 it blindsided FX markets when it engineered a 2% drop "to make its exports more competitive and shore up growth in the flagging economy."
The timing of the Fed's rate decision was another big story that occupied traders and investors until year-end when Ms. Yellen finally delivered and markets—at least in the short term—jumped on the news.
U.S. markets offered their own surprises. The Dow, S&P 500 and the NASDAQ each it record highs this past year, with the NASDAQ breaking records multiple times between April and late July.
With such a full year in the markets' rear-view mirror, and as 2015 winds down, we asked 11 of our most popular contributors how they're preparing for the coming year. We received a provocative mix of views and strategies and have divided the responses into two articles. Part II, below, offers insight into where the 7-year equity bull might be headed. Part I, published earlier this week covers commodities, currencies and contrarian opinions.
Joseph L. Shaefer: Bad Markets, Good Sectors
This bull is wheezing. With some wonderful red capes being waved in front of it, the best it can do is a half-hearted stumble forward before retreating again. I believe we are headed for a correction and am stressing good solid income holdings that will be less-affected by US rate rises. Two closed end funds, Templeton Global Income (N:GIM) and Invesco Dynamic Credit Opportunities (N:VTA) are at the top of our list.
But we also believe the one sector that has been in a bear market since 2014 is likely to surprise on the upside in 2016. Energy companies have taken their lumps but this boat is now overloaded on one side. It costs nations like Saudi Arabia, Venezuela, Nigeria, Iraq, Russia and Iran billions a year in gas subsidies, heating and cooling subsidies, free education, housing free or subsidized, food subsidies, etc. (Saudi Arabia alone spends $100 billion annually to keep its populace from tossing them out.) Yet these (mostly OPEC) countries have decided to play global chicken.
As they drive themselves ever nearer to bankruptcy, OPEC has forced US frackers to idle rigs and the big deep-water drillers and oil sands "miners" to write off or delay $200 billion in projects in 2015 alone. But unlike the many years it takes the big companies to complete mega-projects, frackers can (severely!) tighten their belts and wait... because it takes them only 30-90 days to re-start production at full bore. Who will benefit most? I think it will be the regulated pipeline, transport and storage firms that are in a 50, 60 and 70% bear market today. Any rebound in sentiment and these firms will see immediate benefit. We like two closed-end funds in particular to provide solid income without any K1 hassles: Nuveen Energy MLP Total Return (N:JMF) and Claymore MLP Opportunity (N:FMO). Caveat Emptor — if oil and gas prices decline, so will these CEFs' assets, so do your own due diligence.
Strawberry Blonde: Debt Bubbles and Volatility
What would cause retail and proprietary trading banks to tighten lending and begin to call in their loans?...Possibly a major "accidental international incident" in the (internationally-crowded) Middle East, involving Russia and the West/Europe and/or Middle-Eastern countries? In such a scenario, we may see the price of Oil and Gold spike, contrasting with a major, world-wide sell-off in bank stocks, in particular, along with equity stocks, in general. The markets in the U.S. could be especially hit hard, inasmuch as 68.4% of its GDP was comprised of personal consumption expenditures in Q3 of 2015 (it has averaged around 68% since 2008). The question becomes, would banks pass a stress test under those circumstances?
Until then, I think we'll see world Central Bankers continue to inflate equity markets and influence currencies by keeping interest rates low (or relatively low), thereby keeping Oil and Gold prices depressed—which, then, keeps inflation low—which, in their minds, could serve to validate their reasons for maintaining low interest rates and/or some form(s) of Quantitative Easing —perpetuating this never-ending cycle of low economic growth, in which we seem to be stuck and, which, world governments seem to be incapable of, or unwilling to, address.
The question, then, becomes how much could markets advance next year, if a major international incident did not occur? Possibly around 5-6%—a bit higher than this year's increase, which peaked (as of today's writing of this article...December 7th) at its (daily closing) high of 3.49% on May 21st -- in a potential run-up to the U.S. presidential election to be held on November 8th.
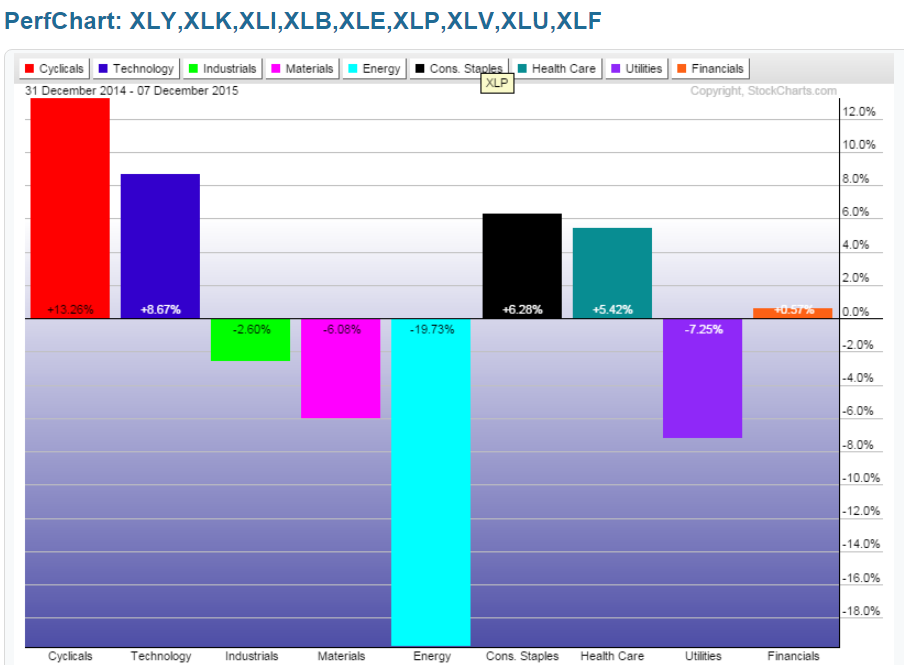
In that case, I'd keep an eye on the Technology Sector and Cyclicals to continue to outperform other sectors in the U.S. and to see if the Financials Sector begins to, substantially, firm up, along with the Industrials Sector. Otherwise, we may only see a repeat of 2015 and achieve around a 4% increase, or less, for 2016. Here's how they've performed, so far this year, as shown on the following Year-to-Date graph of the 9 Major Sectors...
Regarding the Financials Sector, the following three Daily ratio charts are worth noting...they show the strength/weakness of the:
- XLF (U.S. Financials ETF) compared to SPX
- EUFN (European Financials ETF) compared to STOX50
- GXC (Chinese Financials ETF) compared to SSEC
Each chart shows that price is trading at or near major price resistance and their converging 50 and 200 MAs, and that all of these financial sectors are currently weaker than their country's counterpart Major Index...the last two at a considerable discount. Unless we see all three of these firm up and outpace their major indices, I doubt we'll see that 5-6% potential target increase achieved in U.S. equities.
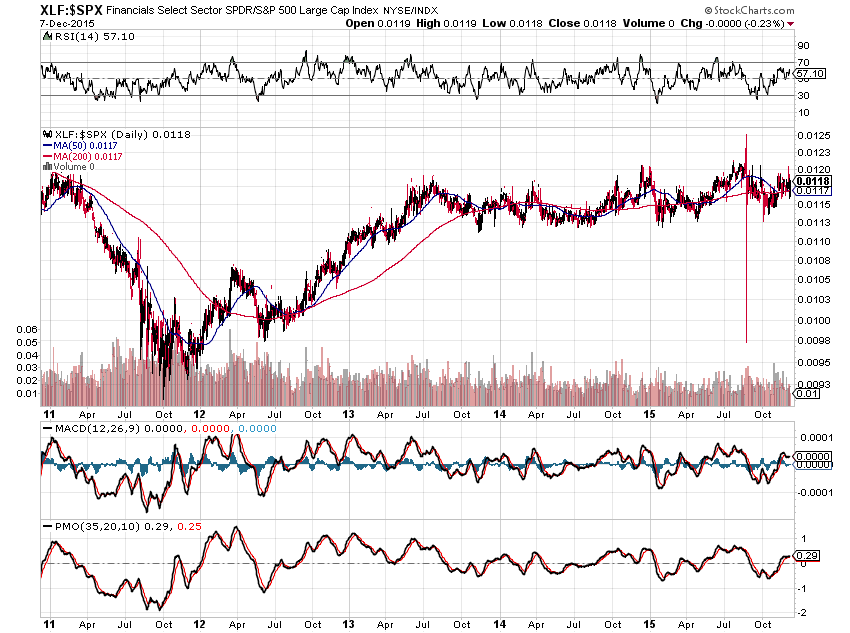
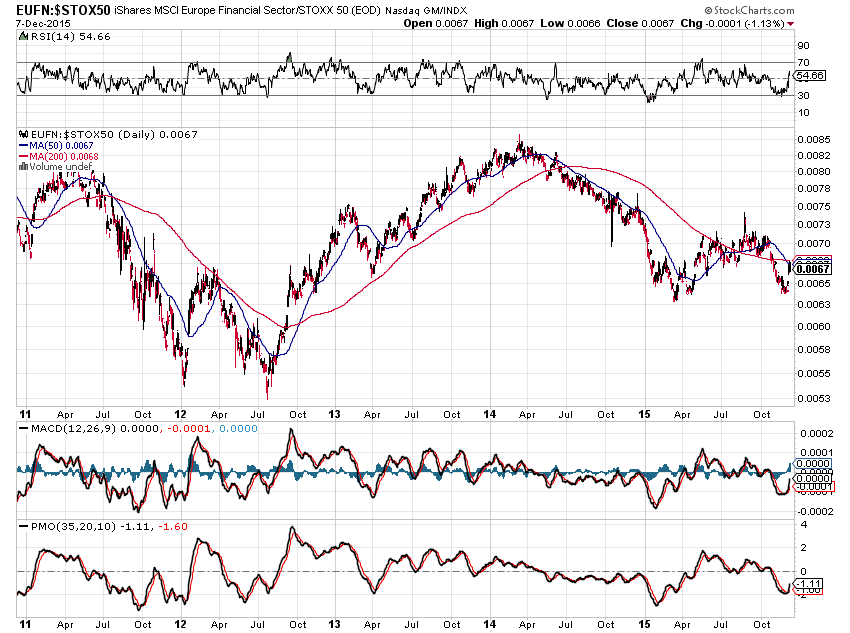
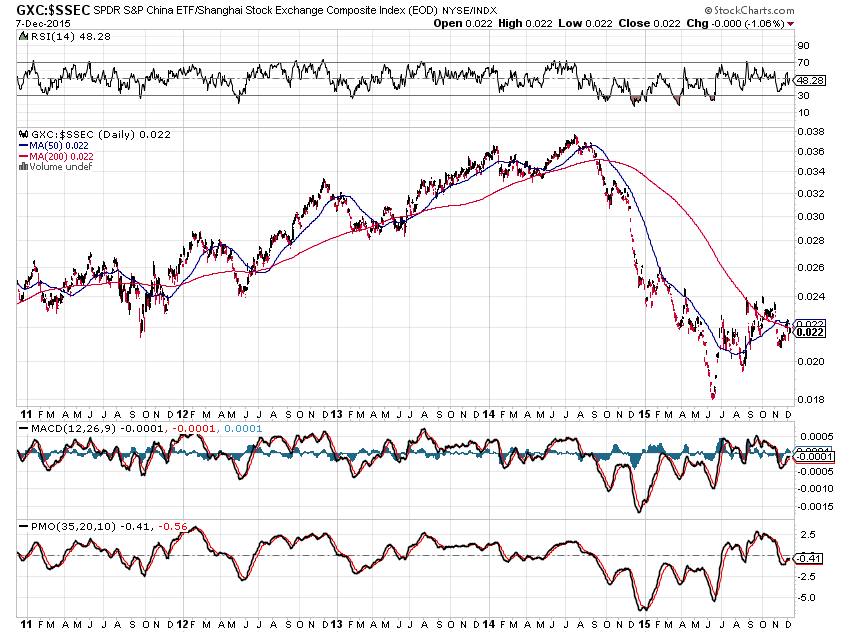
In any event, as mentioned in my post of December 3rd, I'll re-iterate that, "I think 2016 will see greater volatility and much larger swings than we've seen this year." My comments and chart contained therein still apply (and are worth monitoring, along with the above charts and graph, over the coming weeks and months) regarding major resistance and support levels on the SPX:VIX ratio and equity market follow-through.
Kay Kim: The Trend Is Still in Effect
When it comes to the market, there are always opinions, speculations, feelings, emotions, and predications which people believe to be "true". With today's easily accessible information coming from pretty much anywhere in the world, how do we know what actually is "true" and what is not?
Charles Dow, the founder of the Wall Street Journal and, along with his partner Edward Jones, devised the 'Dow Jones Industrial Average' in the late 1800s, realized early on (we are talking over 100-years ago!), that only "the tape" (price) is true and everything else is just human emotions at play. It was important for Mr. Dow to study the charts and the price-action to determine potential outcomes, how much more important therefore is it for us to do this today.
One of the most important and profound Dow Theory principles advocates: "The trend is assumed to be in effect until it gives us a clear signal that it has been reversed."
Below are weekly charts of each of the 3 major indices (Dow Jones Industrial Average, S&P 500 Index, and NASDAQ Composite:
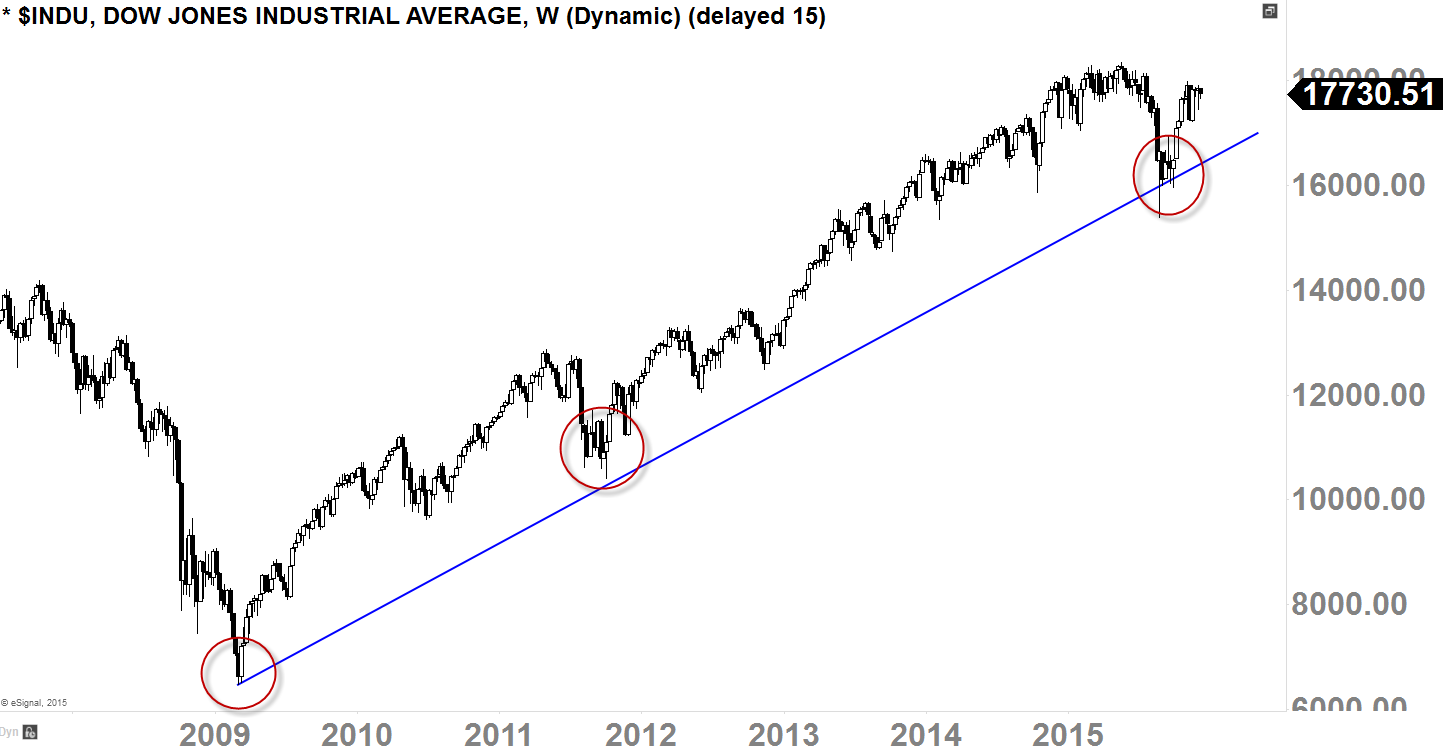
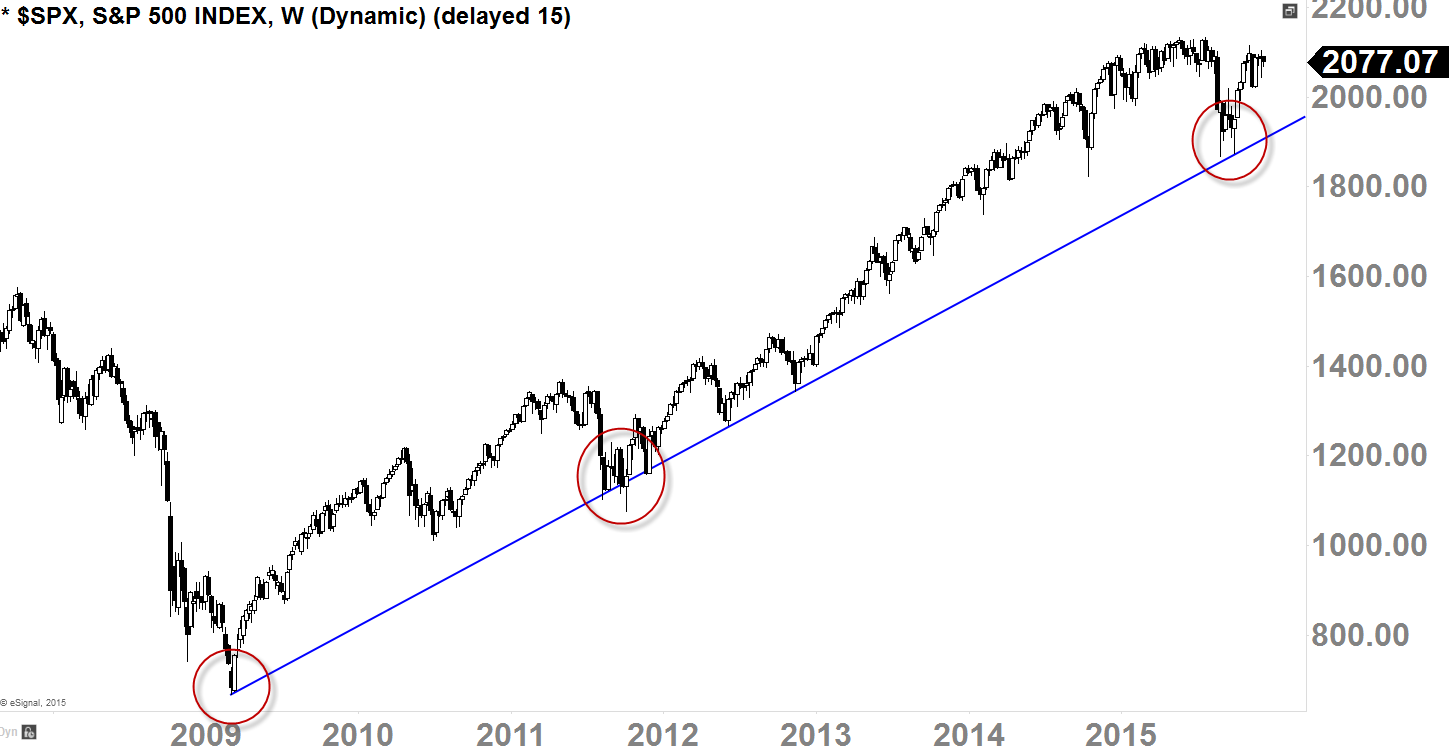
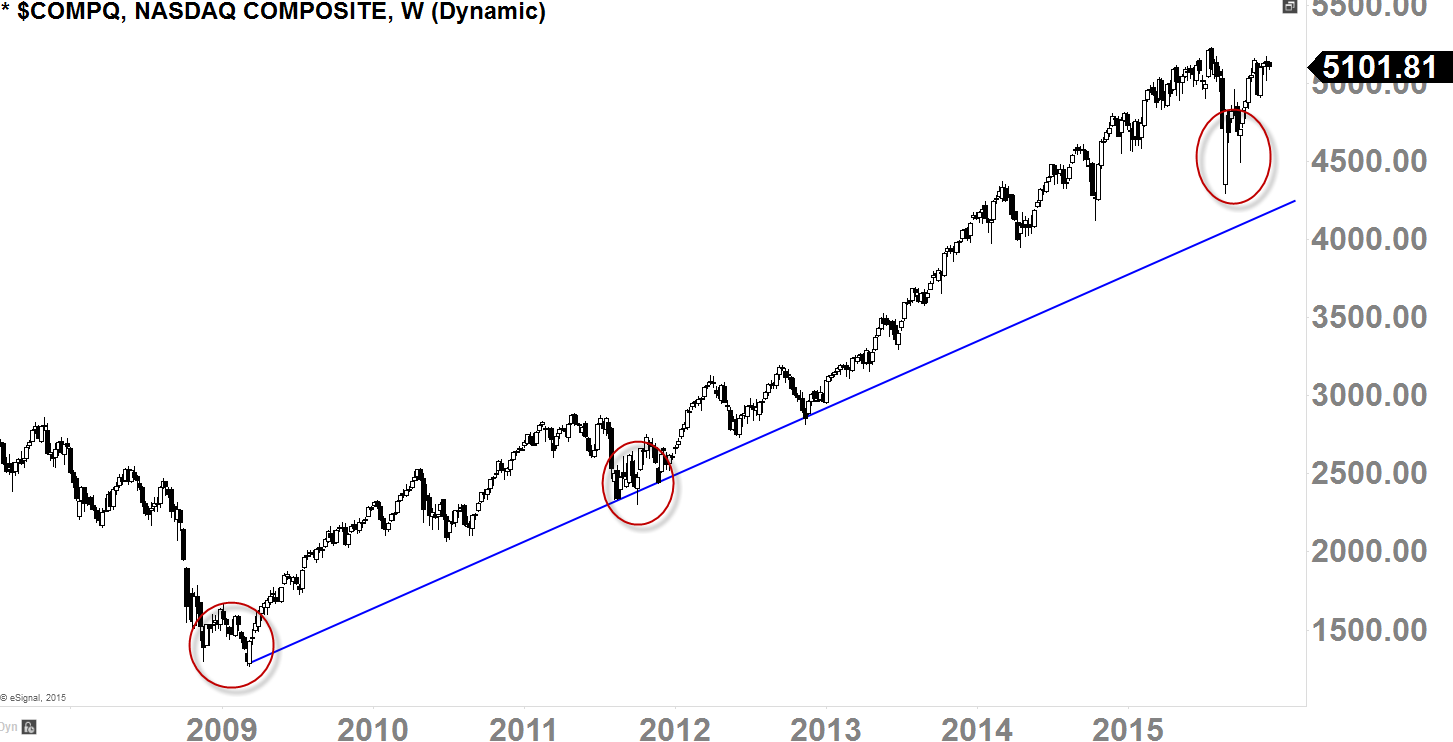
The charts indicate the trend is still in effect because we do not have a "clear signal that it has been reversed", and per Dow Theory, we must respect this primary-term uptrend, which means not only the "benefit of the doubt goes to the buyers" for the next 2-3 years (speaking in a primary-term perspective), this is the opportunity you have been waiting for since 2009 and 2012.
How many investors have been kicking themselves over the last few years, saying, 'I wish I had put all my money in during 2009 and 2012'? Most people didn't put any money in 2009 and 2012 because the "fear" was still looming in the market, just like what's happening today.
Of course, we understand the fact that nothing is absolute and no one knows the market's outcome with 100% accuracy, but what we have are the probabilities, and with recent move we've seen last few months, I am in the camp that the market is almost out of the "correctional" phase, and getting ready to resume back up to it's primary-term uptrend.
Al Brooks: S&P Test of October 2015 Low
The most interesting chart going into 2016 is the monthly chart of the ES Emini. It held above the 20 month exponential moving average for 38 months until August 2015. Although this is a sign of strength, it is extreme, and therefore climactic. The only two other times in the past 50 years when the S&P cash index held above its 20 month EMA were in 1987 and in 1999. The 1987 buy climax was followed by a 36% correction and the 1999 rally was followed by a 22% correction.
The sample size is small, but there is an important point here. Whenever there is a buy climax, bulls take profits. They do not want to buy again one or two bars later. The market usually needs to go sideways-to-down for a couple of legs and at least 10 bears before buyers begin to get confident that the selloff has ended. Ten bars on the monthly chart is about a year. The correction so far has been sideways for 4 months. There is a 60% chance of at least another 6 months of sideways to down price action, whether or not there is a new high first.
If the Emini goes to a new all-time high in December, there is a 60% chance that the breakout will fail, and it will be followed by a TBTL (Ten Bar, Two Leg correction) in 2016. While there is a 30% chance that the breakout would be followed by a 350 point measured move up from the October 2014 and October 2015 double bottom, there is a 70% chance that the bull breakout would be limited to 100 points or less, and be followed by an attempt at a reversal down.
So what does this mean for investors? If someone is looking to hold onto a position for a year or more, the math is better to wait to buy until after a 10-20% correction in 2016, given there is about a 60% chance of one happening. I repeatedly said the same thing for the first 6 months of 2015. The opportunity to buy was brief and scary, but it was there in August.
There is a 30% chance that the correction will drop below the October low and hit the monthly bull trend line, which is around 1700. The next target for the bears is the 2000 and 2007 double top at around 1600. The Emini has about a 20% chance of getting there in 2016. If any of these targets are reached, it will be hard to buy, just as it was in August 2015, but it would also probably be a great time to buy. A lower risk way to buy is to wait until after a strong reversal up from these levels. There will be less left to the rally and the stop would be further away, creating a worse risk/reward, but that is the price traders always have to pay if they want a higher probability trade.
The best stocks to buy if there is a 20% correction are the obvious ones, like Apple (O:AAPL), Amazon (O:AMZN), Facebook (O:FB), Alphabet (O:GOOGL), Microsoft (O:MSFT), Netflix (O:NFLX), Home Depot (N:HD), Starbucks (O:SBUX), Nike (N:NKE), JPMorgan Chase (N:JPM), Mastercard (N:MA), Lockheed Martin (N:LMT), Disney (N:DIS), and Delta Air Lines (N:DAL). The EURUSD is oversold in a bear market, and it could go mostly sideways in 2016. The bear trend in gold is intact. There will be buyers at 1,000, but it probably will have an 8 handle before the bear trend evolves into a trading range. The selloff in crude oil is also climactic, and a sell climax is usually followed by a trading range. The low might have a 30 handle, and the top of the range will probably be around the May high, below 70.
Ben Reynolds: Significant Market 'Cool Off'
The bull market that started in March of 2009 has carried us through the last 6 years. 2016 could be different. The Federal Reserve will likely raise interest rates in 2016. This will cause declines in low or no growth securities with high dividend or interest payments. Specifically, long-term corporate bonds will likely decline. In equities, the utility and REIT sectors will likely underperform the market average. Two sector ETFs to consider: Utilities Select Sector SPDR (N:XLU) and Vanguard REIT (N:VNQ).
In addition to rising interest rates, the global economy is threatening to stall. Growth slowdowns in emerging markets combined with instability in the Middle East could cause markets to 'cool off' significantly.
Jani Ziedins: Negative Sentiment Already Priced In
What does 2016 hold for us? The best place to start looking for answers is in our past. Over the last 50-years the S&P 500 finished higher 78% of the time with a median gain of 18%. But what about those pesky off-years? The remaining 22% of the time we finished in the red, but with a more modest 10% median loss. These phenomenally favorable odds explain why the S&P 500 is up a staggering 10,800% over the last 50-years. Without anything else to go on, clearly the smart move is sticking with the market.
But everyone wants to know if 2016 will be a typical year. Even though the S&P 500 is within a few percent of all-time highs, bearishness remains unusually elevated in most sentiment surveys. It seems the crowd is far more concerned about this six-year-old bull market than excited to embrace it. And who can blame them? Looking at the last 12-months of headlines, it is far easier to recall bearish stories because there were so many of them.
But as a contrarian, the crowd’s cynical outlook is constructive because it means a lot of negative sentiment is already priced in. I fear markets that stop going up on good news, not ones that fail to sell off on bad news. Inevitably the news cycle will shift and we will stumble into a wave of positive headlines. The S&P 500 that struggled to move beyond 2,100 throughout 2015 will explode higher when these cynics are transformed into believers.
While it is impossible to predict the surprises we will encounter over the next 366 days, given this sentiment skew and the fact we ran out of owners willing to sell bad news, the odds of a good year for US markets are even more favorable than the historical averages suggest.
