Get 40% Off
⚠ Earnings Alert! Which stocks are poised to surge?
See the stocks on our ProPicks radar. These strategies gained 19.7% year-to-date.
Unlock full list

DKS Pops, Chart Looks Strong

Published 03/12/2018, 12:43 PM
Updated 07/09/2023, 06:31 AM

Dick’s Sporting Goods Inc (NYSE:DKS) is up 5% on Monday morning. This is happening the day before releasing its earnings results for Q4 2017, which includes a quarter dominated by holiday shopping for many retailers. Wall Street expectations are for earnings per share of $1.20 and total revenue of $2.73 billion.

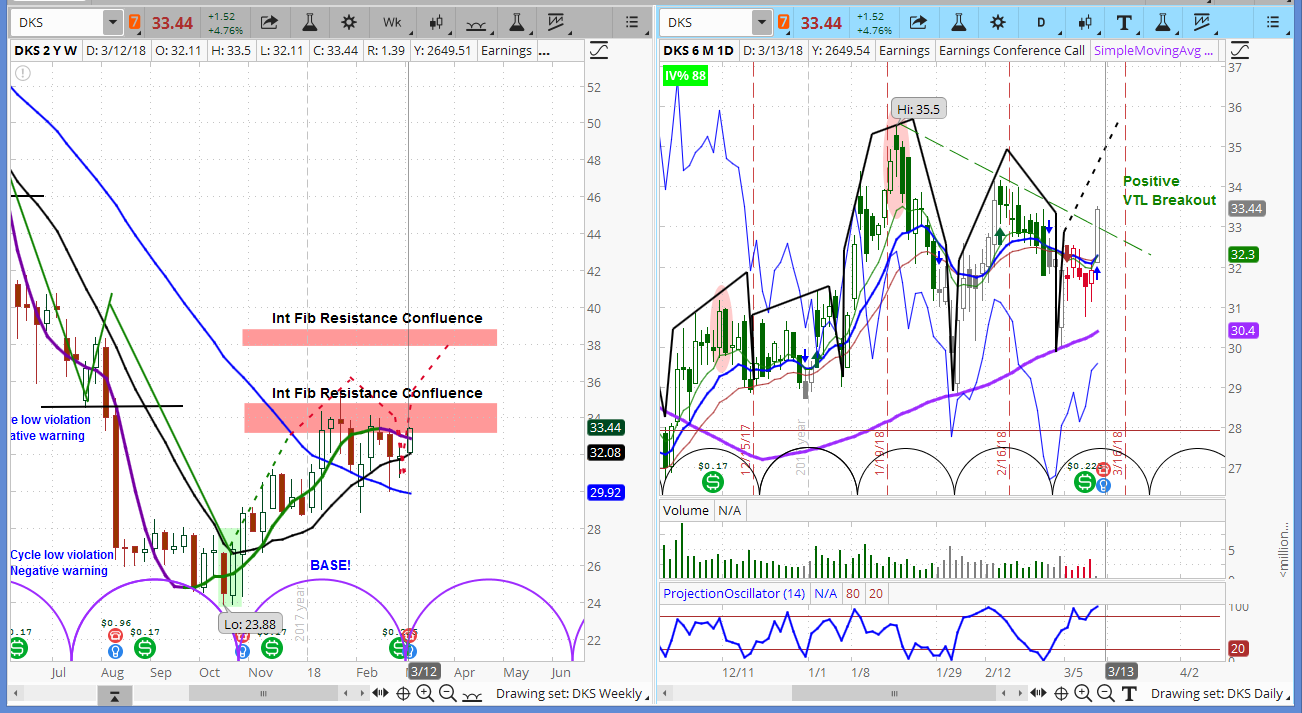
DKS has a strong technical pattern, upon reviewing the charts below. This includes an analysis of its market cycles, which are designated by the semicircles at the bottom. The weekly chart on the left suggests the stock has formed a base and turned upward at the estimated timing for the cycle low.

The daily chart on the right shows a new high for the cycle. It has also broken out from below a valid trend line, represented by the dotted green diagonal sloping down and to the right. This indicates resistance near $38.
Dick’s Sporting Goods (DKS) Charts - Weekly (Right) and Daily (Left)

For an introduction to cycle analysis, check out a clip of our Big Picture Analysis, or visit askSlim.com and become a free Level 1 member for the full version. To receive notifications for our askSlim Market Week on Fridays, subscribe to our YouTube channel.

Latest comments

Risk Disclosure: Trading in financial instruments and/or cryptocurrencies involves high risks including the risk of losing some, or all, of your investment amount, and may not be suitable for all investors. Prices of cryptocurrencies are extremely volatile and may be affected by external factors such as financial, regulatory or political events. Trading on margin increases the financial risks.
Before deciding to trade in financial instrument or cryptocurrencies you should be fully informed of the risks and costs associated with trading the financial markets, carefully consider your investment objectives, level of experience, and risk appetite, and seek professional advice where needed.
Fusion Media would like to remind you that the data contained in this website is not necessarily real-time nor accurate. The data and prices on the website are not necessarily provided by any market or exchange, but may be provided by market makers, and so prices may not be accurate and may differ from the actual price at any given market, meaning prices are indicative and not appropriate for trading purposes. Fusion Media and any provider of the data contained in this website will not accept liability for any loss or damage as a result of your trading, or your reliance on the information contained within this website.
It is prohibited to use, store, reproduce, display, modify, transmit or distribute the data contained in this website without the explicit prior written permission of Fusion Media and/or the data provider. All intellectual property rights are reserved by the providers and/or the exchange providing the data contained in this website.
Fusion Media may be compensated by the advertisers that appear on the website, based on your interaction with the advertisements or advertisers.
© 2007-2024 - Fusion Media Limited. All Rights Reserved.