Johnson & Johnson Proves Why You Want To Own Dividend Kings
Johnson & Johnson (NYSE:JNJ) is no growth stock, not in the classic sense, but it is a blue-chip company repositioned for growth and one that pays a very healthy dividend. Not only that, the company is a Dividend King with 59 years of consecutive dividend increases under its belt making it one of the safest payouts on Wall Street. The company just declared the latest dividend increase, an increase worth 5% to current shareholders, and has plenty of room on the books to keep doing so long into the future. If you are looking for a safe play on secular growth with a market-beating 2.50% yield you could much, much worse than Johnson & Johnson.
Johnson & Johnson Beats And Raises, Shares Steady
Johnson & Johnson had a great first quarter despite the impact of its COVID-19 vaccine getting sidelined. The company reported $22.32 billion in revenue or up 7.9% from last year. The revenue beat the consensus by 280 basis points and led the company to narrow its guidance for the full year. As for the vaccine, the vaccine brought in about $100 million of less than 0.45% of the net revenue. If there is an impact from the vaccine pause we aren't seeing it in the macro data.
"Johnson & Johnson delivered a strong first-quarter performance led by the above-market growth of our Pharmaceutical business and continued recovery in Medical Devices," said Alex Gorsky, Chairman, and Chief Executive Officer.
"The ability to deliver these results while simultaneously advancing our robust pipeline of life-enhancing medicines, products, and solutions during these times is a testament to the strength and resilience of our business and the dedication of the 135,000 employees of Johnson & Johnson who strive every day to profoundly change the trajectory of health for humanity and make healthier communities for everyone, everywhere."
On a segment basis, the International segment outpaced the U.S. at 12.2% growth versus 3.9% with medical devices leading in both categories. Medical Device sales rebound 10.9% from last year while Pharma grew 9.6% to account for 54.7% of sales. The Consumer segment was the only weak spot, down -2.3% from last year, but last year's Consumer segment comp is a tough one as it coincides with the earliest and strongest phase of pantry loading.
Moving down the report, the company's margins narrowed mildly and less than expected but still delivered strong results on the bottom line. The GAAP EPS of $2.32 grew 6.9% from last year, slightly slower than revenue, but the core adjusted EPS of $2.59 beat by $0.24 and grew 12.6% from last year. Looking forward, the company is expecting sales strength and earnings growth to accelerate and have guided accordingly. The full-year guidance was narrowed from its previous range for both revenue and earnings to a range with a midpoint in line with the consensus. Based on the recent data and the strength we expect to see in the U.S. and global reopening we view this guidance as cautious.
The Technical Outlook: Johnson & Johnson Ready To Move Higher
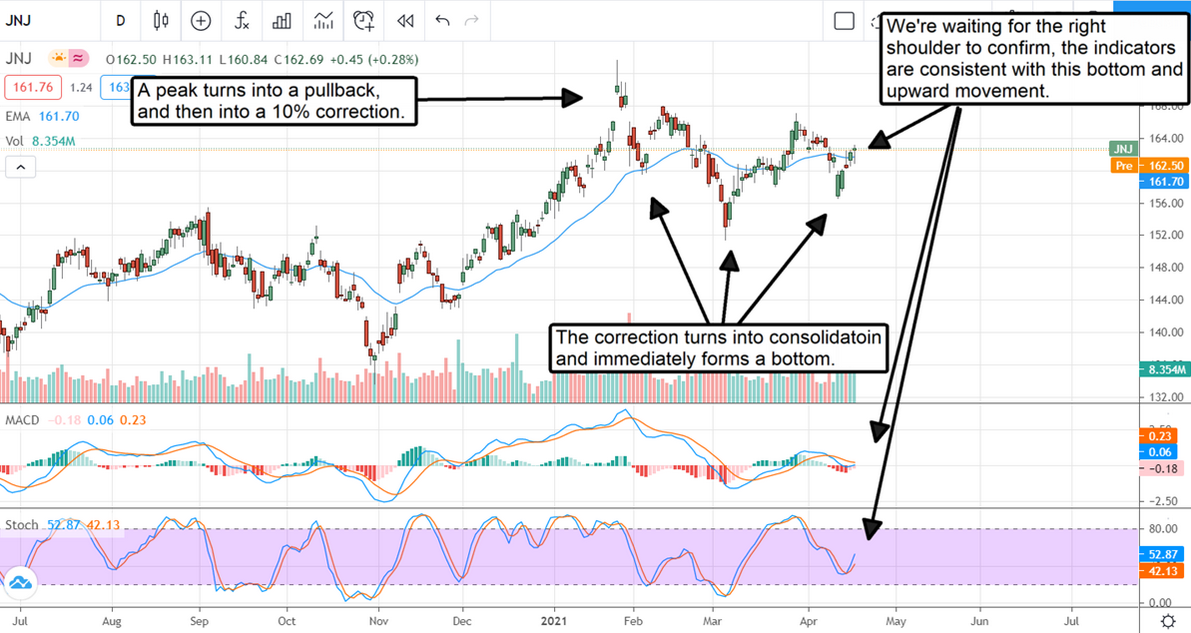
Shares of Johnson & Johnson are down mildly in premarket action but look ready to spring higher at any moment. The stock has been in a consolidation that, to us, echoes what we've been seeing across the market; bottoming patterns within a sideways trading range. The JNJ chart has been in consolidation since the Q4 reporting period and formed a very clear Head & Shoulders Reversal. This is an example of when a reversal may not be from down to up or up to down but from sideways to up and then up again. The key levels to watch now are support at the right shoulder near the short-term 30-day EMA at the $161.70 level. If this level confirms again we see shares of JNJ moving back up to $166, $168, and then $170 before breaking out to new highs. If not then this stock may be stuck in consolidation but we don't think so.

