- Ace Limited (N:ACE), Automatic Data Processing Inc (O:ADP), Microsoft Corporation (O:MSFT) and Raytheon Company (N:RTN) look to us to be attractive long-term dividend growth investments; and they have been so in the long-term and short-term past
- High quality, low leverage stocks with long histories of persistent dividend payment and growth are important in the low forward price return US stock market expected for the next few years
- Free cash flow is to be prized in stock selection when thinking about weathering storms
- Stocks that have paid and increased dividends though multiple recessions could help investors sleep on those investments
Most analysts agree that total return for US stocks over the next few years will be modest. When expected price returns are high, dividend yield takes a back seat for many investors (not necessarily conservative or retired investors), because of their low contribution to total return. When expected price returns are modest or low (as they are now), dividends get up in the front seat, and maybe even the driver’s seat.
It seems to us that at least for a good part of a portfolio for retirees and near-term pre-retirees, dividends should be in the front seat. That is not necessarily something for younger investors with at least, say, 10 years before retirement; and who are still in the earning and asset accumulation stage of their financial lives.
So this investment note is probably more suitable for the retiree or near-term retiree crowd (or any other investor who for whatever reason is attracted to dividend stocks). And this note is not about reaching for yield. It is about finding high quality, steady dividend growth companies, that have weathered the test of time; and up and down markets.
We always begin our search for opportunity with a quantitative filter. We think you really have to do that, unless you rely in tips on TV, radio or investment media — something that will not expose you to the full range of possibly good ideas. And, more importantly, such tips will seldom give you much depth — but you can research them to see if they work for you if that is your cup of tea.
I suppose you could say this article also a tip, but we think its different. It is different, in great part, because we take you through the steps of how we got to our conclusion, so you have the basis to make your own evaluation, and to determine what additional research you need to do for your self if any of the ideas here seem potentially attractive.
There are thousands of ways to set up a filter with different criteria categories and different parameters within the categories; and we use several different filters to generate ideas. This is just one filter, not the only filter than makes sense to us.
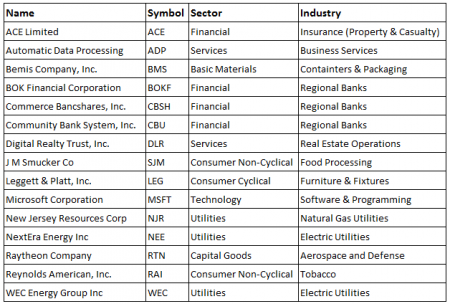
There are over 8,000 listed securities on the NYSE Composite, NASDAQ Composite and NYSE AMEX Composite. Nobody can review them all, so a filter reduces the size of the universe to examine. Our preliminary quantitative filter yesterday reduced 8,000+ securities to a list of 15. Here is how we go those 15.
FILTER CRITERIA:
- Dividend Growth Consistency: Paid and increased dividends for at least 8 years (through 2008-2009 market crash)
- Dividend Growth Rate: minimum 3% annualized over 1, 3, and 5 years
- Current Yield: >= 2%
- Trailing Payout Ratio: less than 100% (except for REITs or MLPs)
- Debt-to-Equity: maximum 2
- PEG Ratio: > 0 and < 3
- 8-Year Price Change: better than zero (traverses last recession)
- 1-Year Price Change: better than negative 5%
- Liquidity: 3-month average per minute trading volume is at least $10,000
- Quality Rating: by at least one of Value Line, Standard & Poor’s, MSCI or Wright Investors’ Services
- Consensus 12-mo Target Price/Market Price: >=1
FILTER RESULTS:
This table lists the 15 filter survivors, along with their sector and industry.
(click image to enlarge)
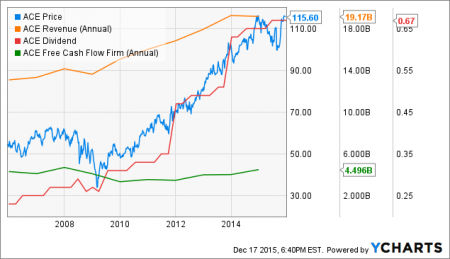
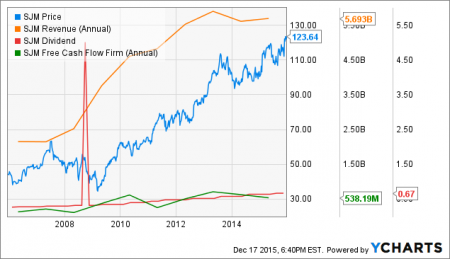
We are concerned these days about free cash flow, that could be helpful if there is margin compression due to a sales slump, increased interest costs, or some other adverse development. Because of that concern, we visually examined free cash flow charts for the 15 filter survivors and found 6 stocks with a nice enough year-by-year pattern and enough total free cash flow to give us some comfort. Their charts are shown below, also presenting their price, their revenue and their dividend.
VISUAL CHART SELECTION
Of the 15 filter survivors, 6 look best after reviewing charts of free cash flow.
Declining revenue at Leggett & Platt Incorporated (N:LEG) is unattractive. Declining revenue at Raytheon Company (N:RTN) is much less concerning, because it was based on defense sequester, which will end; and most importantly RTN’s critical role in weapons systems for the war with ISIS.
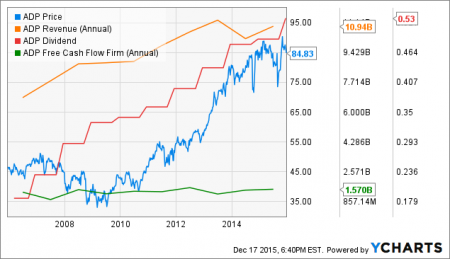
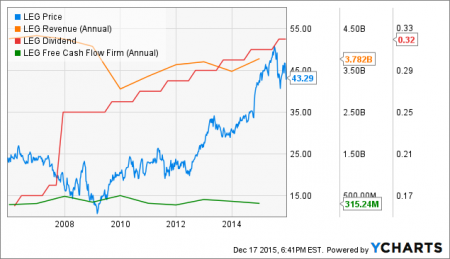
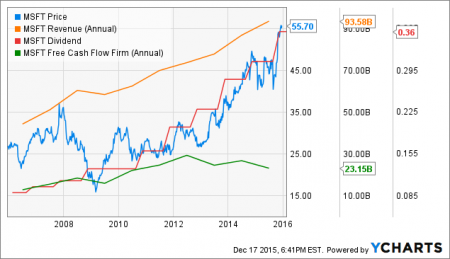
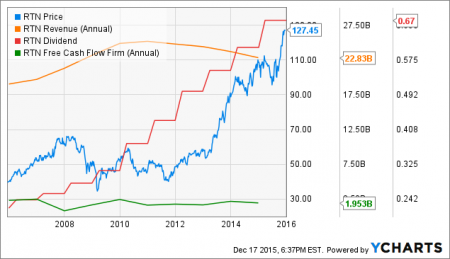
Also because of concerns about a tepid global economy, we would currently favor quality stocks more than usual as an extra level of comfort in the event that things go poorly in the markets. This table shows the quality ratings for the 6 stocks remaining in our filter.
QUALITY RATINGS

A synopsis of how the firms describe their rating goes like this:
- S&P Capital IQ Earnings & Dividend Rank: Growth and stability of earnings and dividends
- Value Line Financial Strength Rating: balance sheet leverage, business risk, the level and direction of profits, cash flow, earned returns, cash, corporate size, stock price, cash on hand, and net of debt
- MSCI Quality Index: Durable business models with sustainable competitive advantage; high ROE, stable earnings with low business cycle correlation, and strong balance sheets with low leverage.
- Wright Investors’ Service Quality Rating: (1) Liquidity, (2) Financial Strength, (3) Profitability & Stability, and (4) Growth. The ratings are based on 32 factors (8 for each of the four rating elements) using 5-6 years of corporate records and other investment data. The highest possible score is AAA20. The lowest possible score excluding certain designations for insufficient information or time frame, is CCC0. They consider the minimum rating for “quality” to be BBB4.
By these ratings, MSFT is clearly best and JM Smucker Company (N:SJM) is probably worst.
INDEPENDENT ANALYST RATINGS:
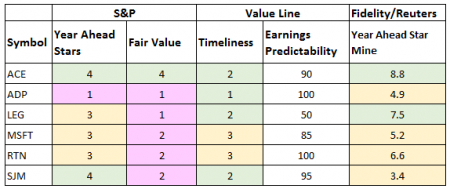
Two leading independent analytics services are Standard and Poor’s Capital IQ and Value Line. They approach the matter of rating differently. S&P is more qualitative and Value Line is more quantitative. They sometimes agree and often do not. An example here is on ADP where they are as far apart as they can possibly be, with S&P saying stay away and Value Line saying jump on board.
Fidelity publishes the view of a variety of mostly independent analysts, and then Reuters uses a proprietary weighting system to come up with a single score from 0-10 called StarMine. They weight the analyst opinions based on the historical accuracy of each analyst firm for the sector in which the stock they are rating belongs.
S&P Capital IQ uses a 1-5 rating system, where 5 is best and 1 is worst (Stars are for year ahead return, and Fair Value is market price versus the S&P view of fair value). Value line uses a rating system from 1-5, where 1 is best and 5 is worst (their Earnings Predictability is a relative measure of the reliability of earnings forecasts).
Here is how each service rated each of our 6 selections.
By these three services, LEG looks better than in the Street consensus and ADP looks worst, based on S&P giving ADP an outright Sell and a most overvalued price versus Fair Value. ACE is clearly on top according to these sources.
SELECTED FINANCIAL DATA:
Nothing beats reading the full SEC filings, and studying the full set of financial statements and footnotes. That said a summary look at selected financial data can focus attention on a stock or divert attention elsewhere.
The first table presents absolute Dollar amounts (in $millions) for selected financial data. The second table presents the same data on a common size basis (each data point expressed as a percentage of sales).
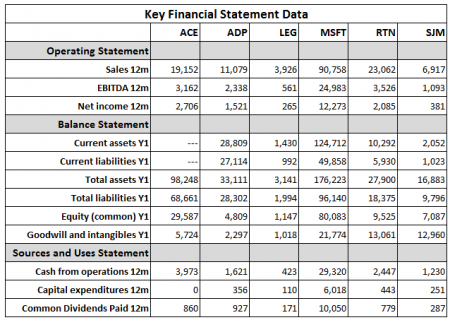
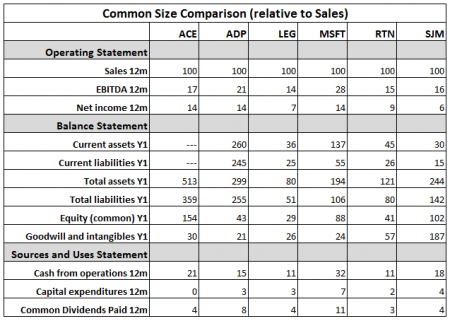
MSFT has the best EBITDA margin, but apparently pays more tax, because it has the same net income ratio as ACE and ADP which have lower EBITDA margins. The all have good Current Ratios (MSFT the best). SJM has a negative tangible equity, because its intangibles exceed its book equity.
GROWTH RATES:
LEG is the weakest in overall growth rates.
ACE seems to be the most consistent average to above average performer, and may benefit most by rising interest rates.
MSFT has been weak on EPS growth, but strong on sales and dividend growth. They have the resources to keep the dividends coming, and their negative EPS has been significantly impacted by write-downs of discontinued businesses, which may not be as problematic going forward.
RTN has poor historical revenue growth, but restocking and development of the US high-tech weaponry arsenal is likely, and they would be a direct beneficiary.
SJM has had earnings growth problems (as has LEG), but has kept dividends growing nicely, and they have some product lines with strong brand equity that should carry them forward (e.g. Smuckers jellies and jams, Jiff peanut butter, Pillsbury, Folgers coffee, Kibbles n’Bits and 9Lives cat food)
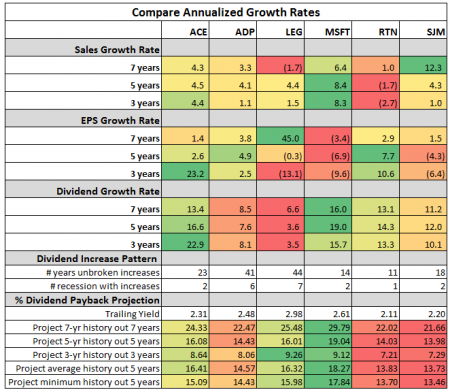
A really important point for us at this juncture in this time of expected low price returns and high importance of dividend return (and for the needs or our mostly near retirement and retired clients), is the persistence and growth of dividends through difficult times.
Each stock in this list of 6 has paid and increased dividends for at least 11 years (RTN) and as long as 44 years (LEG). To put those long periods into more functional perspective, we looked up all of the recessions in the last 44 years and counted how many recessions each stock lived through while paying and increasing their dividend.
The more recessions they weathered, the more likely they are, we think, to weather the next one. If a retiree can count on the dividend, even if the stock price is gyrating (particularly if the retiree can live on the income from the portfolio alone), the more the retiree can sleep at night, and be less concerned about the price of the stock in short periods of a year or two.
LEG persisted with dividend growth through 7 recessions — pretty impressive. ADP persisted through 6 recessions — also pretty impressive.
Just because a stock persisted through fewer recessions is not necessarily a ding on performance, because they may not have existed at all of those times. MSFT is an example of that.
Lastly for growth, we engaged in an entirely hypothetical calculation just to possibly provide some scope of future dividend payback of the original purchase price. These calculations should not be relied upon, just reflected upon.
We projected the 7 years historical dividend growth rate forward 7 years; then the 5-year history out 5 years; then the 3-year history out 3 years to see how much of the purchase price might be recovered before a possible sale of the stock at the end of those periods.
Then we projected out 5 years again using the average of the 7, 5 and 3 year dividend growth rates; and once more using only the minimum growth rate among the 7, 5 and 3 years rates.
By those calculations MSFT looks best and SJM works, and none are bad.
BUSINESS DESCRIPTIONS:
Most of you probably have a reasonable idea what most of the 6 stock do, but here are business descriptions to paint a possibly fuller picture of each company’s business.
ACE: ACE Limited is a holding company. The Company is a global insurance and reinsurance company. The Company offers commercial insurance products and service offerings, such as risk management programs, loss control and engineering and complex claims management. It provides specialized insurance products to niche areas, such as aviation and energy. It also offers personal lines insurance coverage, including homeowners, automobile, valuables, umbrella liability and recreational marine products. In addition, it supplies personal accident, supplemental health and life insurance to individuals in select countries. The Company’s segments include Insurance – North American P&C, Insurance – North American Agriculture, Insurance – Overseas General, Global Reinsurance and Life.
ADP: Automatic Data Processing, Inc. (ADP) is a provider of human capital management (HCM) solutions and business process outsourcing. The Company operates through two segments: Employer Services and Professional Employer Organization (PEO) Services. The Employer Services segment offers a range of business outsourcing and technology-enabled HCM solutions. These offerings include payroll services, benefits administration, recruiting and talent management, human resources management, insurance services, retirement services and payment and compliance solutions. The Company’s PEO business, ADP TotalSource, offers small and mid-sized businesses human resources (HR) outsourcing solution through a co-employment model. ADP TotalSource includes HR management and employee benefits functions, including HR administration, employee benefits and employer liability management, into a single-source solution, including HR administration, employee benefits and employer liability management.
LEG: Leggett & Platt (N:LEG), Incorporated is a manufacturer that conceives, designs and produces a range of engineered components and products found in homes, offices, automobiles and commercial aircraft. The Company operates in four segments: Residential Furnishings segment, which manufactures steel coiled bedsprings; Commercial Fixturing & Components segment, which include work furniture group that designs, manufactures, and distributes a range of engineered components and products primarily for the office seating market; Industrial Materials segment consists of wire group, which operates a steel rod mill and tubing group, which supplies welded steel tubing and Specialized Products segment designs, manufactures and sells products, including automotive seating components, specialized machinery and equipment, and service van interiors. Its brands include Semi-Flex, ComfortCore, Mira-Coil, Lura-Flex, Superlastic, Super Sagless, Tack & Jump, Schukra, Gribetz, Masterack and Hanes, among others.
MSFT: Microsoft Corporation (O:MSFT) is engaged in developing, licensing and supporting a range of software products and services. The Company also designs and sells hardware, and delivers online advertising to the customers. The Company operates in five segments: Devices and Consumer (D&C) Licensing, D&C Hardware, D&C Other, Commercial Licensing, and Commercial Other. The Company’s products include operating systems for computing devices, servers, phones, and other intelligent devices; server applications for distributed computing environments; productivity applications; business solution applications; desktop and server management tools; software development tools; video games; and online advertising. It also offers cloud-based solutions that provide customers with software, services and content over the Internet by way of shared computing resources located in centralized data centers. It provides consulting and product and solution support services.
RTN: Raytheon Company (N:RTN), together with its subsidiaries, is a technology Company that specializes in defense and other Government markets. The Company develops products, services and solutions in markets: sensing; effects; command, control, communications and intelligence (C3I); and mission support, as well as cyber and information security. The Company operates in four segments: Integrated Defense Systems (IDS); Intelligence, Information and Services; Missile Systems, and Space and Airborne Systems. The Company serves both domestic and international customers, as both a prime contractor and subcontractor on a portfolio of defense and related programs primarily for Government customers. The Company’s products include Global Integrated Sensors, Integrated Air & Missile Defense, Cybersecurity and Special Missions, Global Training Solutions, Land Warfare Systems, Advanced Missile Systems, Tactical Airborne Systems, Advanced Missile Systems and Electronic Warfare Systems.
SJM: The J. M. Smucker Company is a manufacturer and marketer of consumer food and beverage products and pet food and pet snacks in North America. The Company has four segments: U.S. Retail Coffee, U.S. Retail Consumer Foods, U.S. Retail Pet Foods, and International, Foodservice and Natural Foods. The Company’s U.S. retail market segments consist of the sale of branded food products to consumers through retail outlets in North America. The Company’s International, Foodservice and Natural Foods segment represents sales outside of the U.S. retail market segments. The Company’s principal consumer food and beverage products are coffee, peanut butter, fruit spreads, shortening and oils, baking mixes and ready-to-spread frostings, canned milk, flour and baking ingredients, juices and beverages, frozen sandwiches, toppings, syrups, pickles, condiments, grain products and nut mix products. The Company’s pet products consist of dry and wet dog food, dry and wet cat food, dog snacks and cat snacks.
OUR CHOICES:
We own ACE, ADP and RTN; are thinking about MSFT, which we have owned in the past.
- ACE as an insurance company will probably benefit by interest rates as they rise
- ADP will benefit by an improving jobs picture, and ever more complex benefits and HR issues
- RTN will benefit by the increasing reliance of high-tech warfare, and the current war with ISIS
- MSFT is coming back with its Windows 10 system, its own computer brand, and cloud platform (and a new and better CEO)
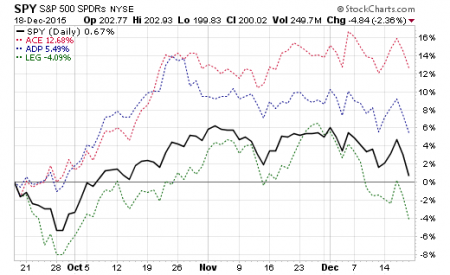
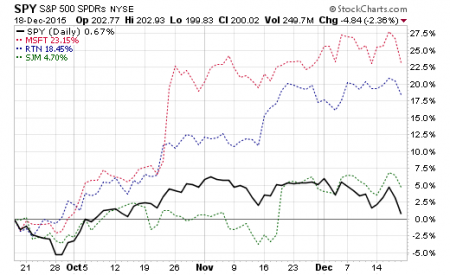
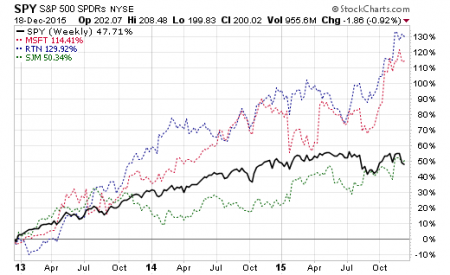
This note was written on Wednesday December 16, 2015. The following charts were generated at end-of-day Friday December 18, 2015.
PERFORMANCE COMPARISON CHARTS
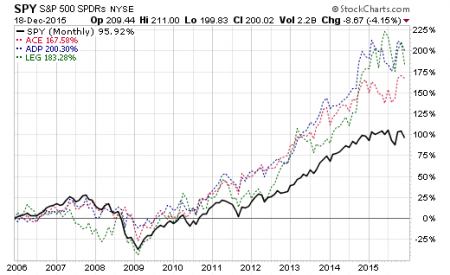
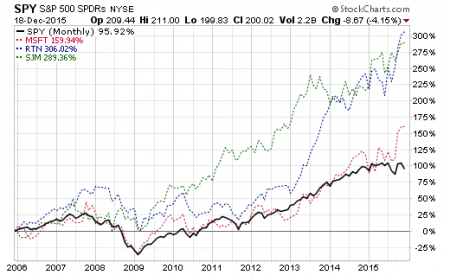
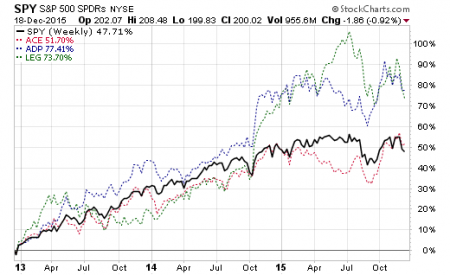
These chars plot the dividend adjusted percentage performance of each of the 6 stocks versus an S&P 500 ETF (in black).
10 Years Monthly
3 Years Weekly
3 Months Daily
