Get 40% Off
🚨 Volatile Markets? Find Hidden Gems for Serious OutperformanceFind Stocks Now

Did Facebook Put In A Long-Term Top?

Published 01/08/2021, 04:22 PM
Updated 07/09/2023, 06:31 AM

While every major index and most stocks are making new all-time highs, Facebook (NASDAQ:FB) stock has so far not joined the party. Did you know it topped August last year? Hence, it is fair to ask with FB underperforming, “did it put in a long-term top?” Here, I use the Elliott Wave Principle (EWP) to assess if this is the case.

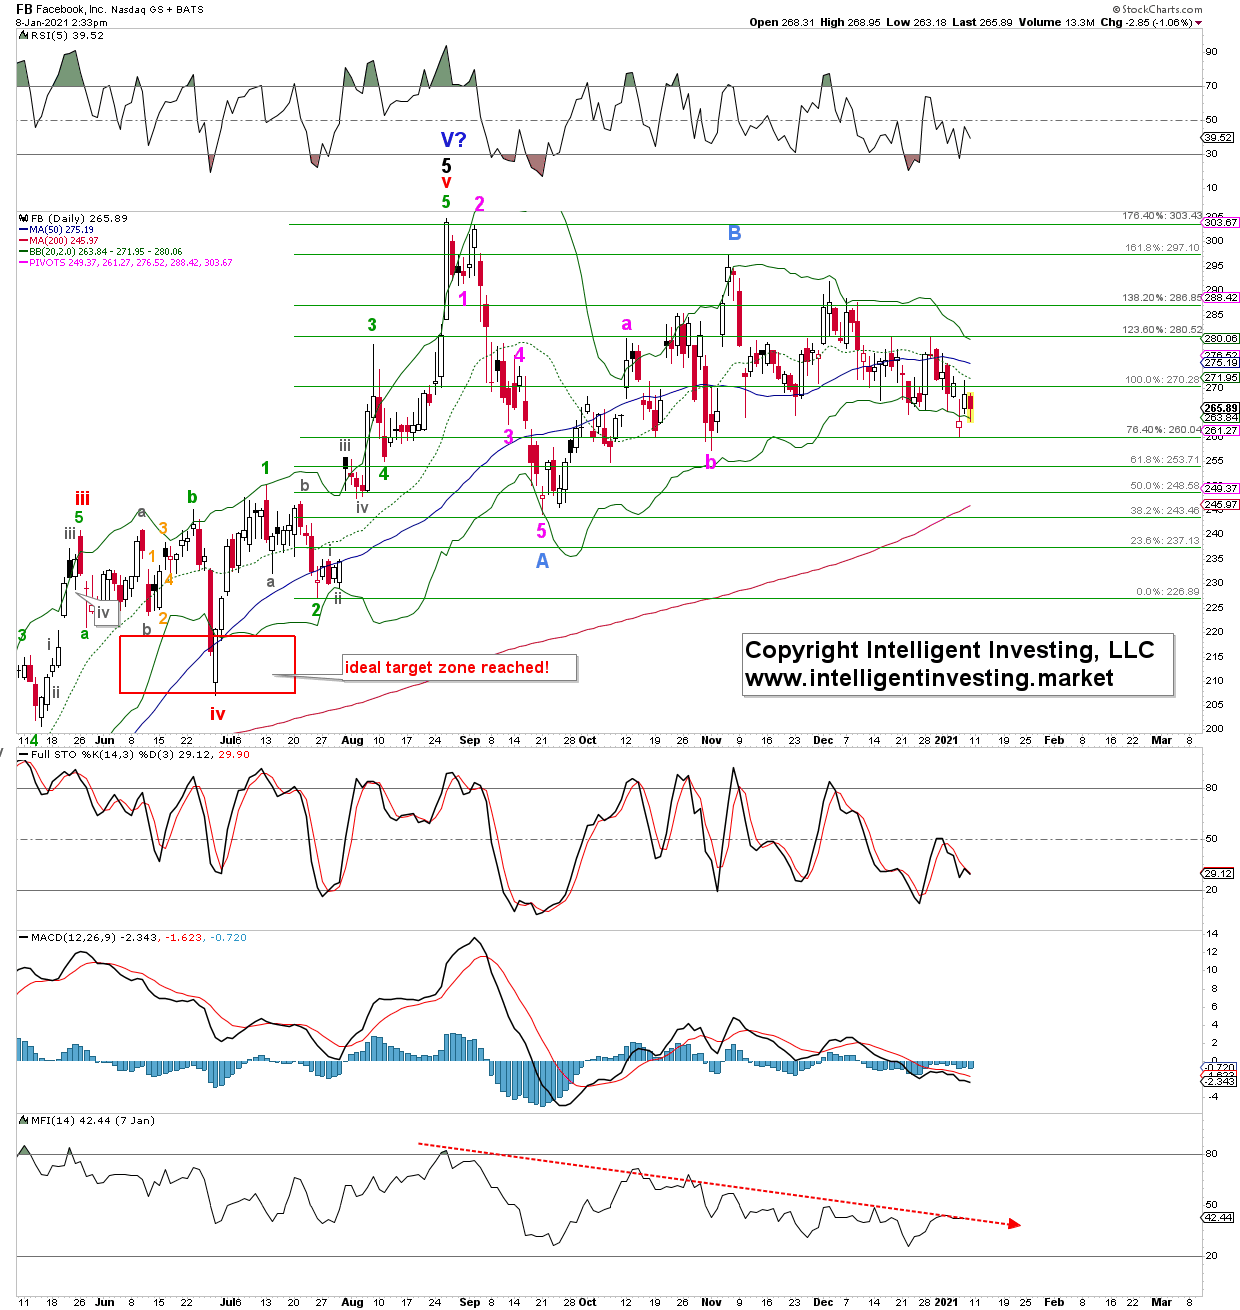
First, I want to draw your attention to FB’s last rally from the June low to its ATH. It bottomed right in the ideal (red) intermediate-degree wave-iv target zone. It then rallied in a classic Fibonacci-based five-wave, impulse, pattern: (green) minor wave-3 was almost exactly 1.23x wave-1, measured from wave-2. Wave-4 then bottomed almost at the 0.618x extension, and wave-5 extended to nearly precisely the 1.764x Fib-extension at $303.43. When 3rd waves do not reach their typical target zone of 1.382-1.618x 1, the 5th wave will most often have to do the heavy lifting: extend.

FB daily candlestick chart with technical indicators and preferred Elliott Wave count into August top:
FB Daily Candlestick Chart With Technical Indicators.

Thus, so far, so good. Since the ATH, FB dropped in what, in my opinion, counts best as five (purple) waves down. Since its September low, it has then advanced in an overlapping fashion to its late-October high. Compare that advance to the clean, non-overlapping impulse pattern I just described, and it is most likely that the recent rally was corrective: a B-wave. Corrections are always made up of at least three waves: A-B-C. Thus if (teal) wave-A and -B completed, then wave-C to lower prices -ideally between $236-198- is now underway. A close below $255 will go a long way to confirm this thesis, with full confirmation on a break below the September low.

3rd party Ad. Not an offer or recommendation by Investing.com. See disclosure here or remove ads .

Facebook’s stock is below its declining 20-day and 50-day Simple Moving Averages (SMAs) from a technical perspective. Thus, it is, in my book, in short- to intermediate-term downtrends. Since it is still above its rising 200-d SMA, I consider it even in a long-term uptrend. But a close below it will further help confirm the Bearish thesis. Besides, all other technical indicators are also trending down: weakening.

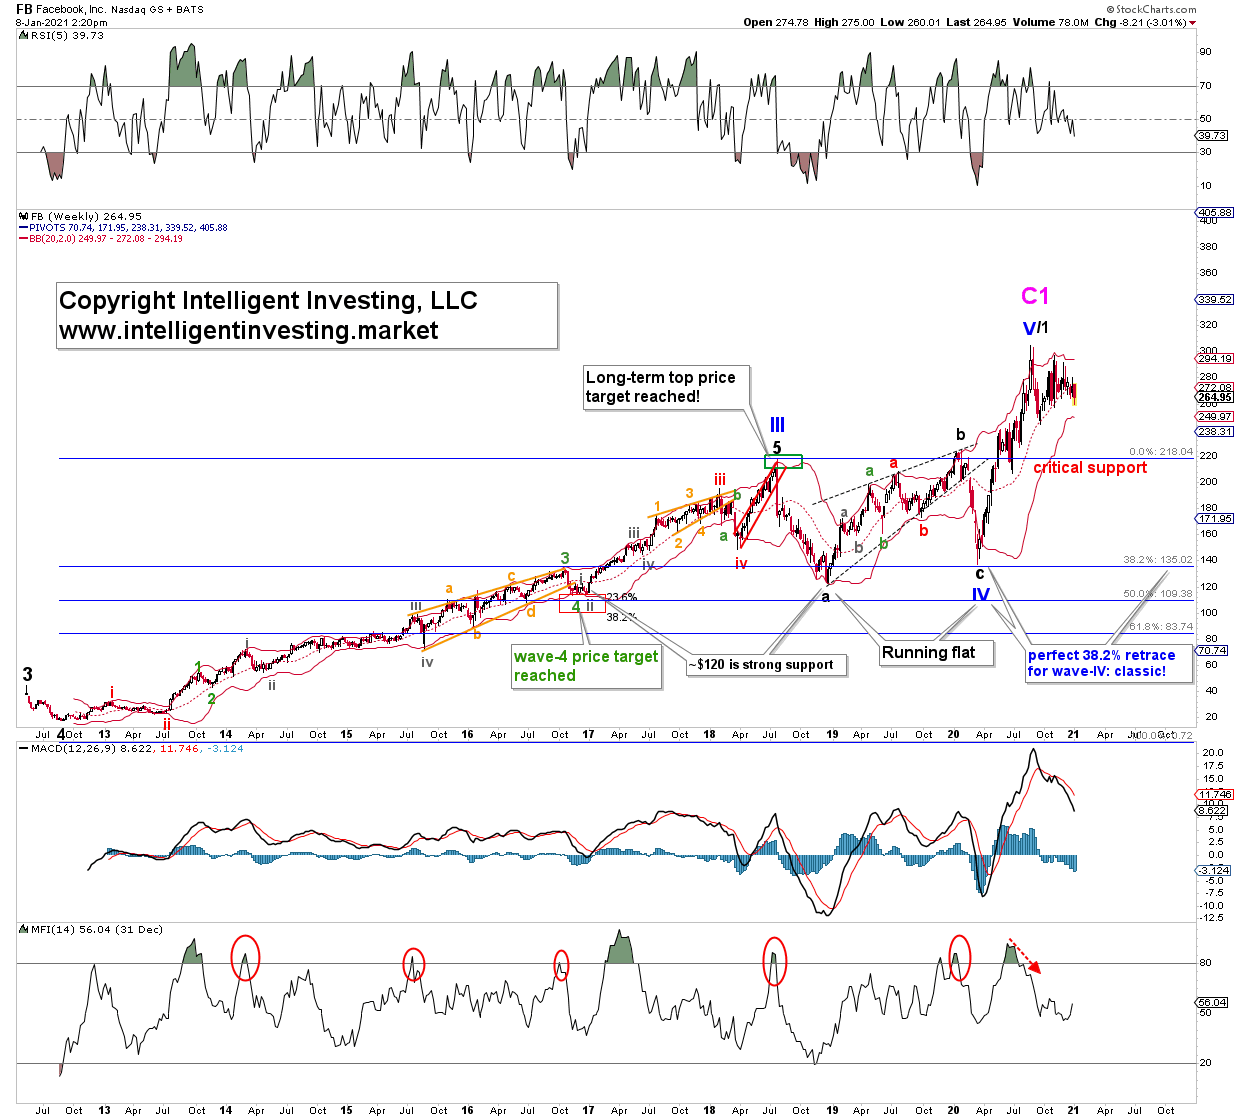
Zooming out, the weekly chart below shows FB’s price action since its IPO. My EWP count shows FB put in a (blue) Primary-III top mid-2018. Then, it completed a complicated primary wave-IV March 2020 in the form of a running flat. Please see here for a more detailed explanation of EWP patterns. Remember, corrections are always at least three waves!

Here, wave-a was the 2018 low, wave-b the 2019 high (where b=a), and wave-c of IV then stopped March 2020 just above the wave-a low. That caused primary-IV to retrace almost precisely 38.2% of wave-III. A classic and typical 4th wave retrace level. Since that infamous low, FB has rallied in five waves up, as I showed in some detail earlier.

FB weekly candlestick chart with technical indicators and preferred Elliott Wave count since its IPO:
FB Weekly Candlestick Chart With Technical Indicators.

The weekly chart and EWP count suggest the August 2020 high was all of Primary-V of Cycle-1, and FB is about to correct most of its eight-year-long rally: with a move back to ideally $75-115 for Cycle-2, but possibly much lower. Given FB has lost 12% since its ATH, while the Nasdaq 100 has added around 16% during that time, I find FB a weak, underperforming asset with a lot of downside potential and, thus, I avoided it for now. The only way for the bulls to avoid such catastrophe is to hold the $236-198 region and rally price above the ATH. Then, FB will have many months of good times ahead.

3rd party Ad. Not an offer or recommendation by Investing.com. See disclosure here or remove ads .

Latest comments

Yep, time to dump Facebook and Twitter, just purely on principle. Let's sting these Tech Oligarchs where it hurts the most --- in the wallet!!
Will you give an update on tesla again ? Seems its about at typical max 5. Wave ext.
Nect week. I just recovered from covid, so i am back logged like crazy. But yes, very extended 5th wave. Will be retraced entirely on next correction.
Thank you. I really like the work you share here. Good to hear you recovered.
Great Article; FB is also having tax disputes with the IRS which will increase its ETR significantly and dent the bottom line
who still uses FB in 2021?
I think this analysis could be easiliy applied to almost all big tech stocks.
Yup. I got $100 puts on this gold mine. Been holding them for since last month once i started seeing those anti trust law suits.
I like your analysis and think the entire market is wildly over valued. With regard to FB I would be a buyer in the $180-190 range. I have analyzed many companies over the years and none have the strong fundamentals of FB. It's a pretty great business model when users actually create content and a company pays them virtually nothing for it. Kind regards and thank you.
Good analysis. But these are probabilities. FED ZIRP till 2023 would keep stocks going higher unless until it becomes too big and crumbles under its own weight!
Risk Disclosure: Trading in financial instruments and/or cryptocurrencies involves high risks including the risk of losing some, or all, of your investment amount, and may not be suitable for all investors. Prices of cryptocurrencies are extremely volatile and may be affected by external factors such as financial, regulatory or political events. Trading on margin increases the financial risks.
Before deciding to trade in financial instrument or cryptocurrencies you should be fully informed of the risks and costs associated with trading the financial markets, carefully consider your investment objectives, level of experience, and risk appetite, and seek professional advice where needed.
Fusion Media would like to remind you that the data contained in this website is not necessarily real-time nor accurate. The data and prices on the website are not necessarily provided by any market or exchange, but may be provided by market makers, and so prices may not be accurate and may differ from the actual price at any given market, meaning prices are indicative and not appropriate for trading purposes. Fusion Media and any provider of the data contained in this website will not accept liability for any loss or damage as a result of your trading, or your reliance on the information contained within this website.
It is prohibited to use, store, reproduce, display, modify, transmit or distribute the data contained in this website without the explicit prior written permission of Fusion Media and/or the data provider. All intellectual property rights are reserved by the providers and/or the exchange providing the data contained in this website.
Fusion Media may be compensated by the advertisers that appear on the website, based on your interaction with the advertisements or advertisers.
© 2007-2024 - Fusion Media Limited. All Rights Reserved.