
DENTSPLY SIRONA Inc. (NASDAQ:XRAY) announced preliminary fourth-quarter 2017 results.
The company reported adjusted earnings per share (EPS) of 82 cents, beating the Zacks Consensus Estimate by a penny. However, per the preliminary results, the metric decreased 22.4% year over year.
Preliminary net sales increased to $1,091 million from $996.5 million a year ago. Also, the figure surpassed the Zacks Consensus Estimate of $1056.0 million and rose 5.3% at constant currency (cc) exchange rate.
The top line was favorably impacted by approximately $21 million as a result of inventory build in the distribution channels. The stock carries a Zacks Rank #4 (Sell).
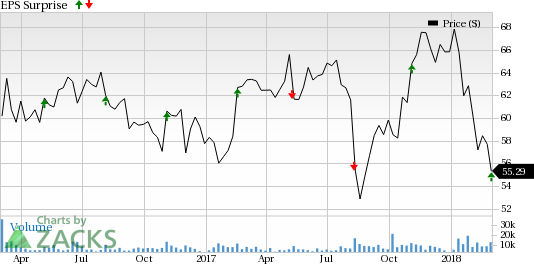
DENTSPLY SIRONA Inc. Price and EPS Surprise
Net sales (Excluding Precious-Metal Impact)
Net sales of the company’s precious-metal dental alloy products, which are used by third parties to construct crown and bridge materials, are subject to risks from fluctuations of precious metal prices.
To avoid the impact of fluctuating prices, DENTSPLY reports net sales with and without precious metal content to show actual performance, independent of precious metal price volatility.
Preliminary net sales at the segment were $1080.7 million, up 10% year over year.
Segmental Details
The business is organized into two reporting segments: Dental & Healthcare Consumables and Technologies.
Dental & Healthcare Consumables
The segment comprises preventive, restorative, instruments, endodontic and laboratory dental products as well as consumable medical device products.
Per the preliminary results, sales improved 9.1% to $460.8 million in the segment, up 4.6% at cc.
Technologies & Equipment segment
Technologies consist of dental implants, CAD/CAM systems, imaging systems, treatment centers and orthodontic products.
The metric increased 10.4% to $630.2 million in the segment and 5.8% at cc.
Geographic Details
In the quarter, sales in the United States grew 11.2% to $365.7 million, up 11.2% year over year and 9.7% in the country at cc.
Net sales in Europe increased 10.6% to $445.1 million and 2.6% at cc.
Net sales in Rest of World climbed 5.7% to $280.2 million and 3.7% at cc.
Margin Analysis
Gross profit in the reported quarter was $593.3million, up 9.6% year over year. As a percentage of revenues, gross margin expanded 10 basis points (bps) to 54.4%.
2017 at a Glance
The company reported preliminary net sales of $3,993.4 million, up 6.6% year over year. The Consumables segment increased 5.8% to $1,792.6 million (44.9% of net sales) in 2017 while net sales for the Technologies & Equipment segment jumped 7.3% to $2,200.8 million (55.1%).
However, sales of the combined businesses for Technologies & Equipment slipped 0.1% at cc year over year.
The company registered adjusted earnings per share of $2.66 in 2017.
Guidance
Management expects adjusted EPS for 2018 in the range of $2.70-$2.80, reflecting a 16-cent adverse impact on tax expense related to tax reform.
Revenues are projected to rise 3% at cc.
Key Picks
A few better-ranked stocks that reported solid results this earnings season are PetMed Express (NASDAQ:PETS) , PerkinElmer (NYSE:PKI) and Becton, Dickinson and Company (NYSE:BDX) . While PetMed sports a Zacks Rank #1 (Strong Buy), PerkinElmer and Becton, Dickinson carry a Zacks Rank #2 (Buy). You can see the complete list of today’s Zacks #1 Rank stocks here.
PetMed reported third-quarter fiscal 2018 adjusted earnings per share of 44 cents, up 88.3% from the prior-year quarter. Revenues rose 13.7% to $60.1 million.
PerkinElmer posted fourth-quarter 2017 adjusted earnings per share of 97 cents. Adjusted revenues were approximately $641.6 million, up from $567 million a year ago.
Becton, Dickinson reported first-quarter 2018 adjusted earnings per share of $2.48, up 3.9% at constant currency. Revenues totaled $3.08 billion, up 3.7% at cc.
Don’t Even Think About Buying Bitcoin Until You Read This
The most popular cryptocurrency skyrocketed last year, giving some investors the chance to bank 20X returns or even more. Those gains, however, came with serious volatility and risk. Bitcoin sank 25% or more 3 times in 2017.
Zacks’ has just released a new Special Report to help readers capitalize on the explosive profit potential of Bitcoin and the other cryptocurrencies with significantly less volatility than buying them directly.
See 4 crypto-related stocks now >>
PetMed Express, Inc. (PETS): Free Stock Analysis Report
PerkinElmer, Inc. (PKI): Free Stock Analysis Report
Becton, Dickinson and Company (BDX): Free Stock Analysis Report
DENTSPLY SIRONA Inc. (XRAY): Free Stock Analysis Report
Original post
Zacks Investment Research