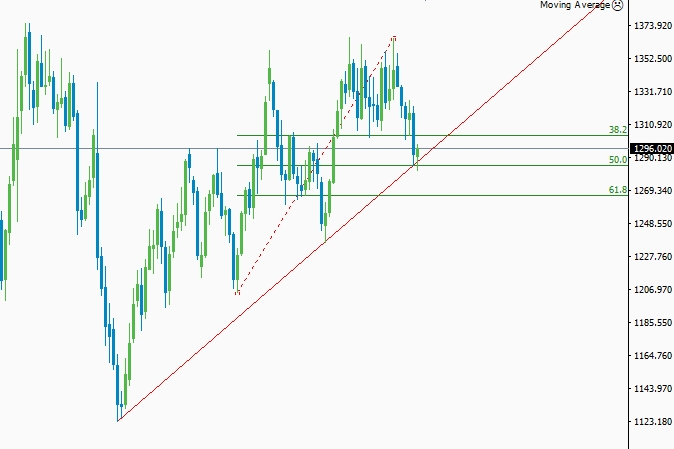
The price of gold sharply fell in the global market after it hit the major resistance level at 1365.09. Majority of the aggressive price action traders went shortly after the formation of the triple top pattern in the daily chart. The medium-term bearish rally has finally come to an end after the price hit the long-term trend line support level. Though the sellers initially breached the trend line support at 1286.35 eventually the bulls took control of the market. The aggressive Aussie traders might think this is the perfect opportunity to execute long but it’s better to wait for the minor retracement towards the trend line support.
Gold weekly chart analysis
Figure: Gold price testing long-term weekly trend line
From the above figure, you can clearly see the bears are getting exhausted as the bulls are slowly kicking in. The long-term position traders of the Rakuten broker is still waiting for a weekly confirmation signal to execute fresh long. This level is going to provide significant support to the gold bulls since the price is trading just above the 50% retracement level. If the bulls manage to take control of the market, the first initial bullish target for this pair would be the next critical resistance level at 1303.72. This level is going to provide a significant amount of selling pressure and the bulls will have to tough time to clear this resistance. However, a clear break of the critical resistance level at 1303.72 will ultimately lead this pair towards the high of 1363.17. This level is very crucial for the long-term investors since a daily closing of the price above that resistance level will confirm the initial bottom formation near the trend line support.
On the downside, we need to break below the trend line support level to wipe out the buyers from the market. Due to ongoing negative performance in the U.S economy, the U.S dollar index is not surging higher. Since the price of gold is measured in U.S dollar, a slight variation in the value of the U.S dollar index greatly impacts the price of gold. We need to see a stronger dollar in near future to clear out the current the current support level. A daily closing of the price below the current trend line support will wipe out the bulls from the market. This will eventually lead this pair towards the next major support level at 1266.76. This level is very crucial for the long-term investors since we have bullish 61.8% Fibonacci retracement level. From this level, we might see some decent bullish bounce but executing long orders without any bullish price action confirmation signal will be an immature act.
Fundamental factors
The recent performance of the U.S economy is not up to the mark and most of the leading economist is expecting prolonged recession period. Moreover, the pending rate hike decision from the FED officials has created an extreme level of uncertainty among the investor's community. In the last FOMC meeting minutes, FED officials clearly stated June rate hike is imminent unless they face any major economic barrier. So, it’s very obvious the gold bulls will have a nice time for the next couple of weeks. However, a strong change in the U.S labor field will definitely push the price of gold lower.
Technical speaking, gold is now trading at a major support level and any bullish price action confirmation signal will be an excellent opportunity to execute long orders. However, we might see some ranging market before we break out the major resistance level at 1303.04. So the short term traders can make a decent profit by shorting the pair with a tight stop. But considering the technical and fundamental analysis, it's better to go with the bulls till we break below the 61.8% bullish retracement level.
