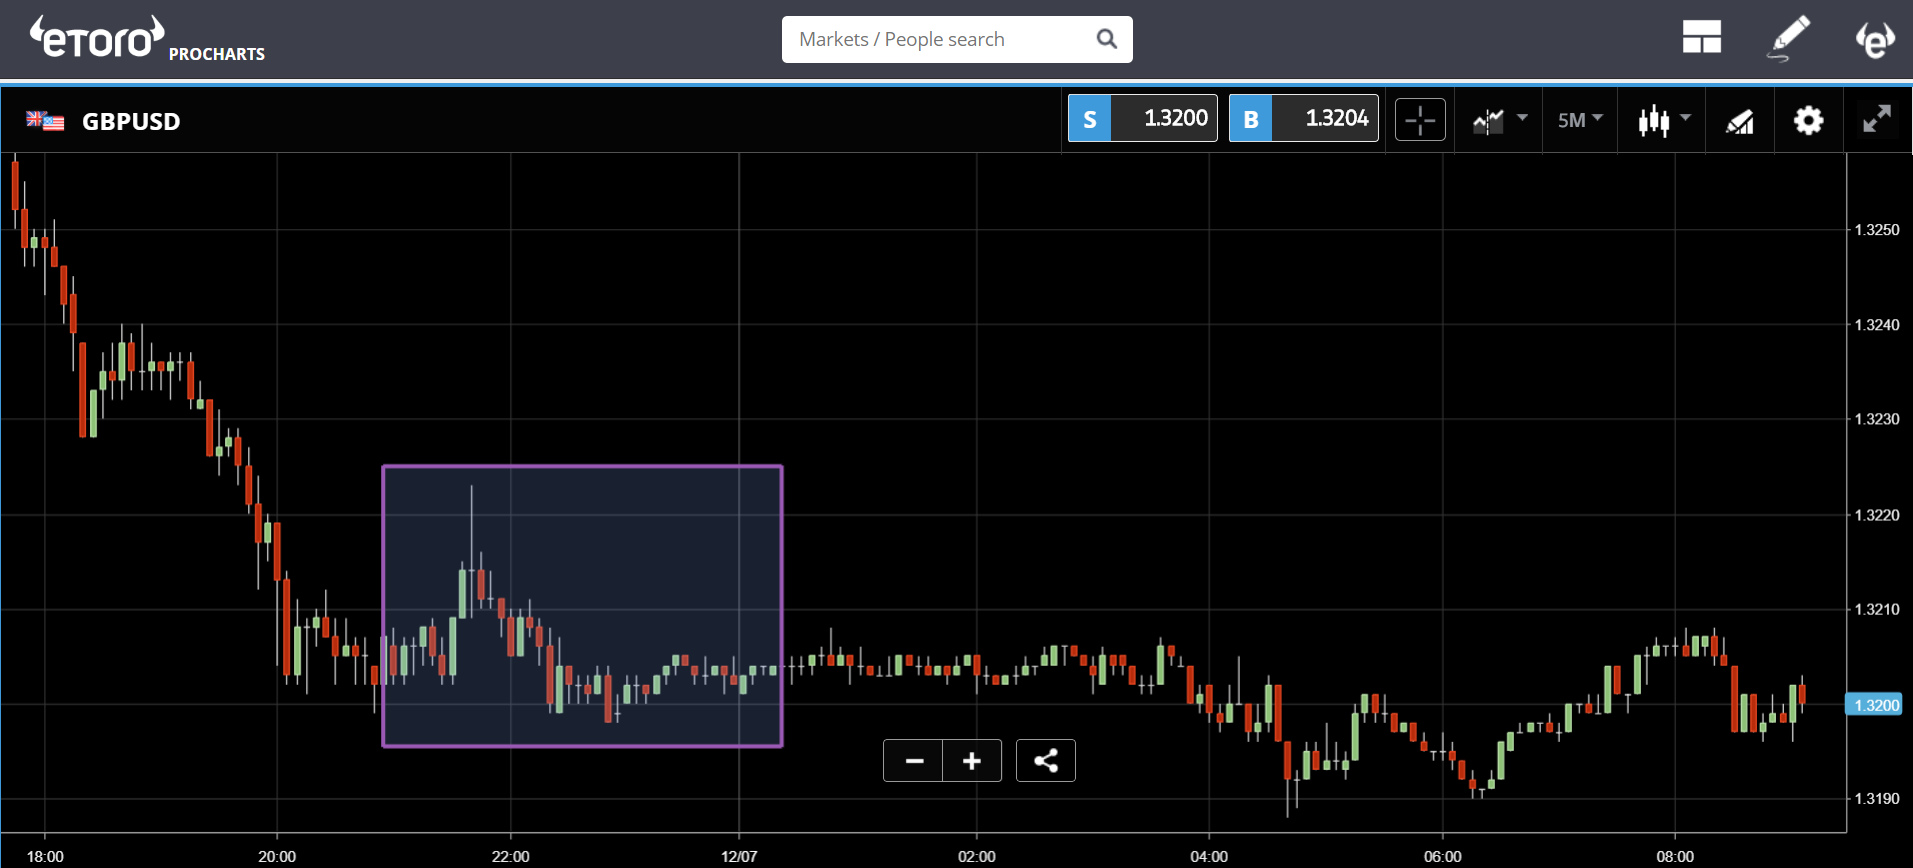
It's rare to see a sporting event having an impact global markets but the graph doesn't lie. Here we can see the action on the pound sterling with the exact time of the game in the purple box.

Notice the rally near the beginning of the game following Trippier's goal, then excitement fading by the end of the game.
It was a great game. Better luck next time, England. Now focus shifts back to Brexit, of which there is much to discuss.
Today's Highlights
100 Pages of Brexit
Trade Talks are On/Off
Bitcoin ETF Decision
Please note: All data, figures and graphs are valid as of July 12th. All trading carries risk. Only risk capital you can afford to lose.
Traditional Markets
After losing several key cabinet members this week, Theresa May's government is not exactly in good health at the moment, which is really not good as there are only 8 months left until Brexit.
Today May's government will release an extensive 100-page white paper that she hopes will clarify the Brexit strategy for her allies and opponents, both in the UK Parliament and those in Europe.
Donald Trump will arrive in the UK today and though the media has chosen to focus on some rather creative protests, there is a hope that he might be willing to lend a hand in the Brexit negotiations. Certainly, Trump could use an ally at the moment after his inflammatory comments at the NATO summit in Brussels.
To his credit, Trump did seem to relax by the end of the day. This has me thinking that maybe just maybe, this hardline stance is just a ruse to ruffle China. By demonstrating his ability to be reckless, Trump believes that it will strengthen his negotiating hand.
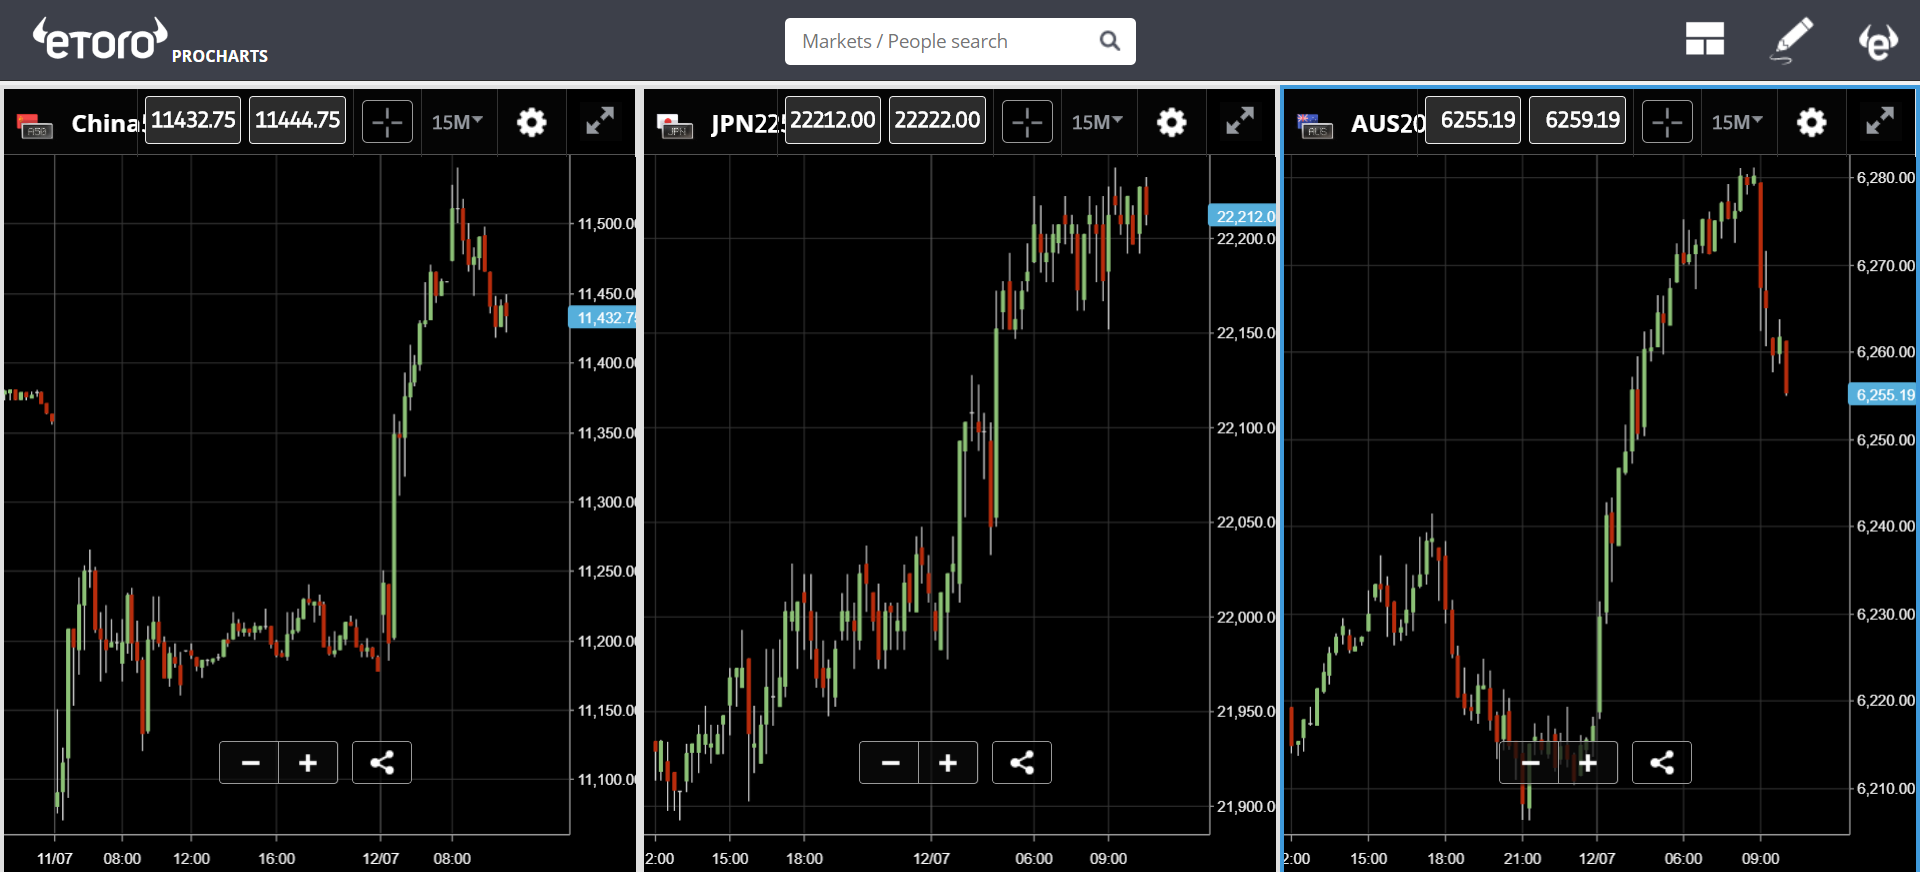
Asian stocks are up this morning on optimism that the trade war may be cooling.

Trade War is On/Off
The initial $50 billion of tariffs imposed by Donald Trump were met with a swift response from China, with an equal amount of tariffs on the United States. However, the latest round of $200 billion that Trump has proposed is more than China could possibly respond to in kind.
As we pointed out in an update from June 19th (titled: Escalation Overflow), China simply does not have $200 billion worth of imports from the United States to retaliate with and so they are currently weighing their options.
The nuclear option would be some sort of reduction in their holdings of US debt. China is currently the largest foreign holder of US treasury bonds by far and a reduction strategy could definitely wreak havoc. However, this would also be bad for China, especially given their globalist strategy.
The other option could come in the form of a devaluation of the Chinese yuan. If China makes their currency cheaper, something that particularly irks Trump, it could potentially offset a lot of the effects of these new tariffs.
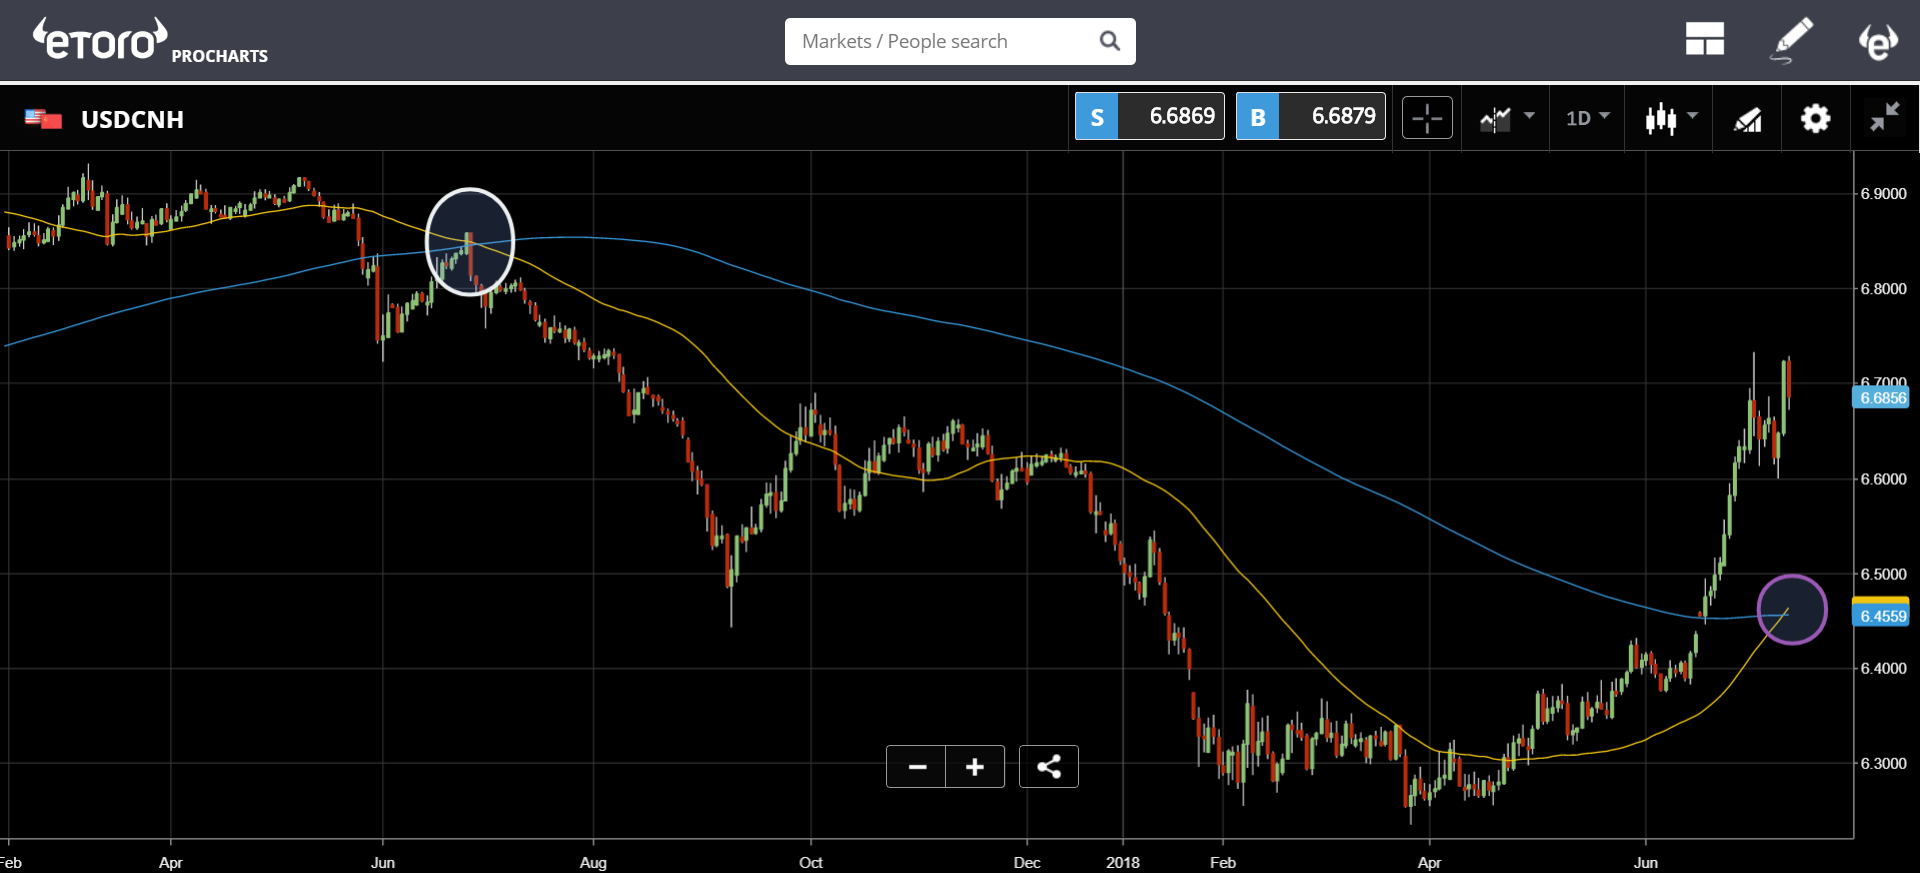
Interestingly enough, an ominous pattern has emerged on the yuan today, which is known to chartists as a "death cross."
In the graph below, you'll notice two lines....
Blue = 200 Day Moving Average
Yellow = 50 Day Moving Average
The last time these two crossed paths (white circle) was almost exactly a year ago, and as you can see it was followed by a tremendous surge in the yuan. So today's death cross (purple circle) is particularly noteworthy.

On the other hand, there is another option here. It seems that the White House may be extending some sort of olive branch and has hinted that the United States is now ready to open a dialogue of de-escalation.
Also, keep an eye out for CPI inflation data today, which will be released 1 hour before the opening bell on Wall Street.
Could we finally get a Bitcoin ETF?
A lot of buzz has been going around the crypto community about a new bitcoin backed ETF.
The prospect of Wall Street traders hodling bitcoin is extremely exciting but there's nothing to celebrate about just yet. The previous attempt to introduce a BTC ETF, famously filed by the Winklevoss twins, was shot down on March 10th, 2017.
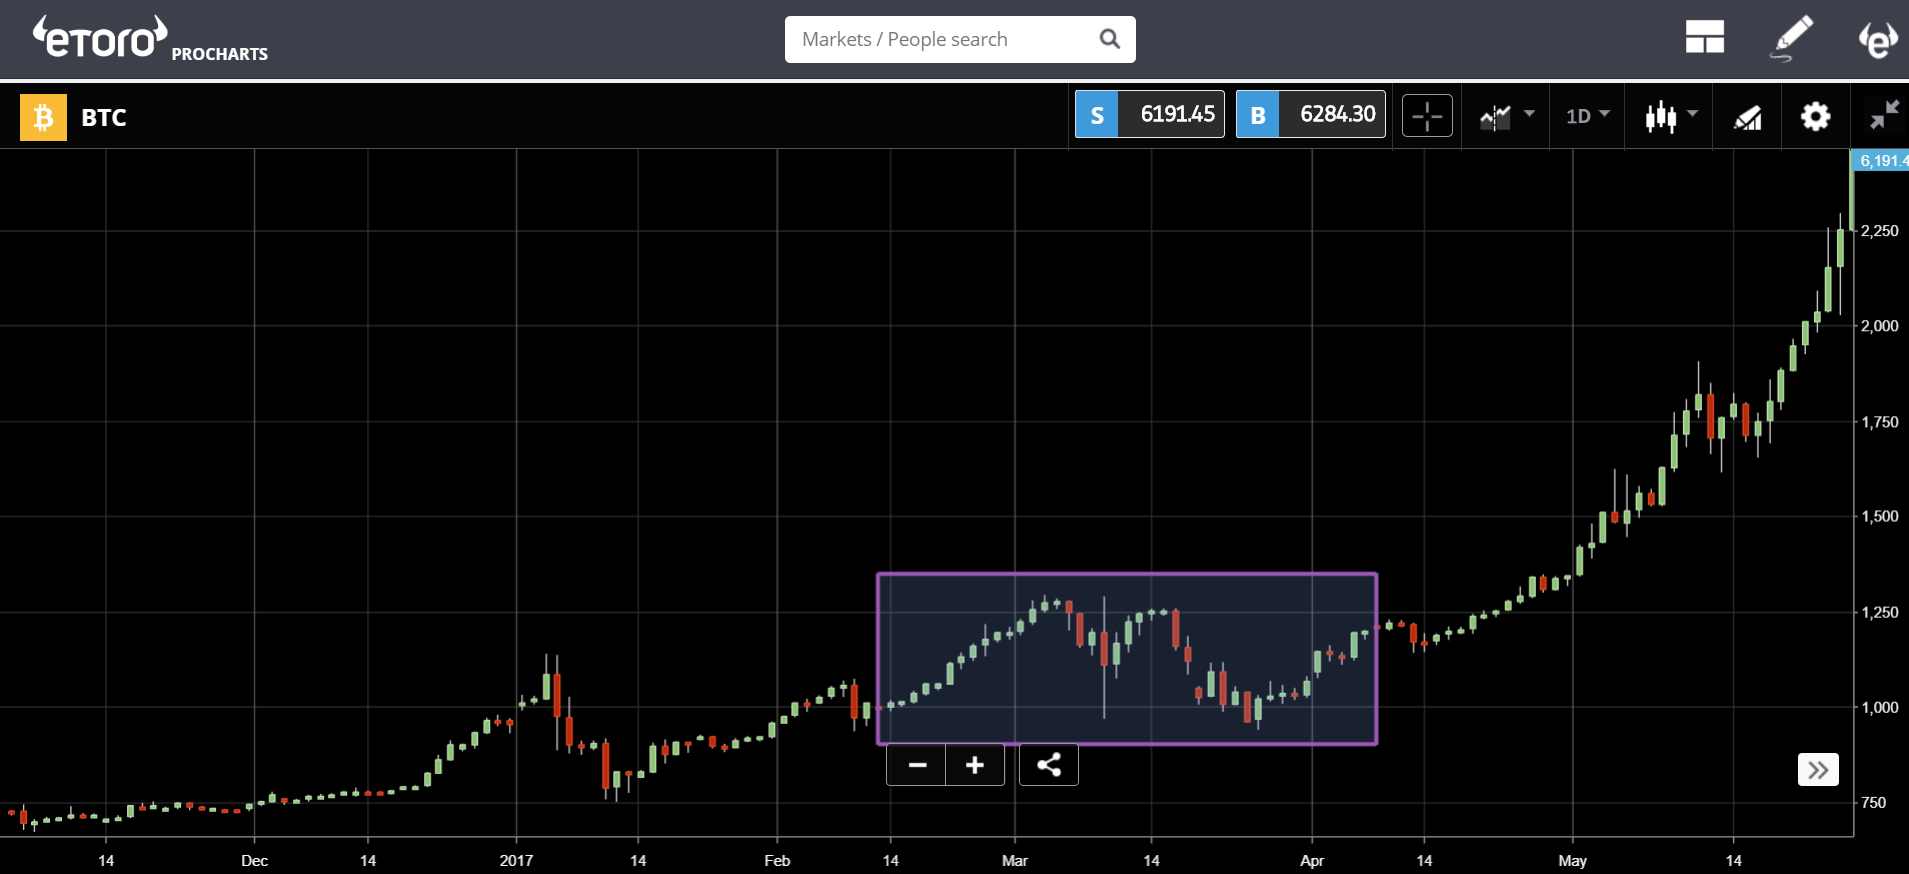
The purple box in this graph shows the excitement leading up the SEC's decision, the volatility on the announcement, the disappointment, and then eventually the market shrugging off the decision and mooning.

If we take a look at that specific day, which can be done using the crosshair tool on the eToro charts, we can see the massive $321 swing from high to low, but the overall outcome of the day was a loss of only $87. What happened next is history.
As we've mentioned many times, Wall Street is currently building the bridges to crypto and this ETF, if approved on August 10th, is an eight-lane super-highway.
eToro, Senior Market Analyst
Disclosure: This content is for information and educational purposes only and should not be considered investment advice or an investment recommendation. Past performance is not an indication of future results. All trading carries risk. Only risk capital you're prepared to lose.
