Get 40% Off
⚠ Earnings Alert! Which stocks are poised to surge?
See the stocks on our ProPicks radar. These strategies gained 19.7% year-to-date.
Unlock full list

YM Emini Moving Higher?

Published 06/13/2019, 12:57 AM
Updated 07/09/2023, 06:31 AM

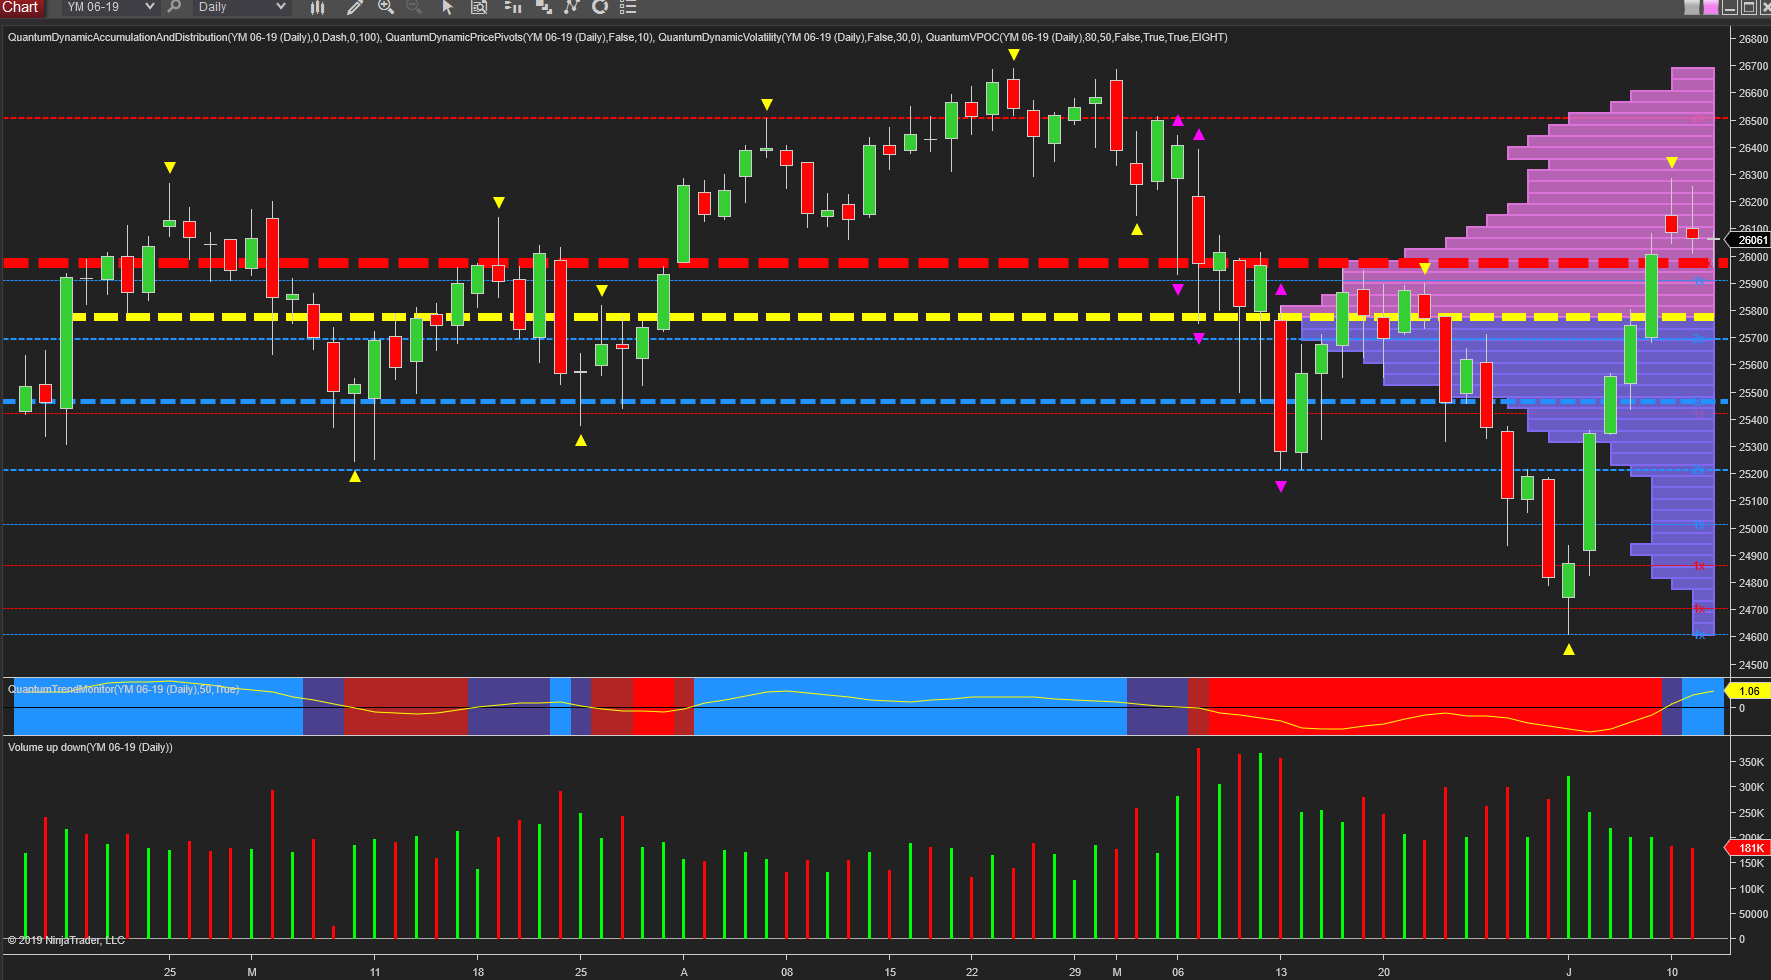
YM Emini Daily

Whether you are a longer-term investor in US stocks or an intraday speculative index trader, the daily chart for the indices is always worth considering in detail, and none more so than now following the recent move higher driven by the prospect of falling interest rates. And perhaps the most interesting example of the three sisters is the YM Emini which is now perched at a delicate point on the chart.

If we begin with the recent rally of July, this was characterized with solid widespread up candles, blasting through level after level of price resistance and finally through the volume point of control itself, denoted with the yellow dashed line. However, note the volume associated with this move, it is falling with strongly rising prices, and so signals weakness ahead, which has duly arrived over the last few days with consecutive days of weakness as the index rallied only to close near the open and creating deep wicks to the upper body as a result. Volume on both was good, but the price action alone is enough to suggest weakness. However, what is perhaps more significant for the longer term is the extremely strong region of price support denoted with the red dashed line of the accumulation and distribution indicator just below 26,000. This is a level which until last week had been acting as very strong resistance, but which was finally breached, and consequently now acts as a strong platform of support and one which has already been tested in trading today.

Note the trend monitor has transitioned to blue, confirming the bullish trend, but if this is to continue, the platform of support at 26,000 needs to remain unbroken, in which case the index should continue higher in the longer term, and on towards weak price and volume based resistance in the 26,500 area.

Latest comments

Risk Disclosure: Trading in financial instruments and/or cryptocurrencies involves high risks including the risk of losing some, or all, of your investment amount, and may not be suitable for all investors. Prices of cryptocurrencies are extremely volatile and may be affected by external factors such as financial, regulatory or political events. Trading on margin increases the financial risks.
Before deciding to trade in financial instrument or cryptocurrencies you should be fully informed of the risks and costs associated with trading the financial markets, carefully consider your investment objectives, level of experience, and risk appetite, and seek professional advice where needed.
Fusion Media would like to remind you that the data contained in this website is not necessarily real-time nor accurate. The data and prices on the website are not necessarily provided by any market or exchange, but may be provided by market makers, and so prices may not be accurate and may differ from the actual price at any given market, meaning prices are indicative and not appropriate for trading purposes. Fusion Media and any provider of the data contained in this website will not accept liability for any loss or damage as a result of your trading, or your reliance on the information contained within this website.
It is prohibited to use, store, reproduce, display, modify, transmit or distribute the data contained in this website without the explicit prior written permission of Fusion Media and/or the data provider. All intellectual property rights are reserved by the providers and/or the exchange providing the data contained in this website.
Fusion Media may be compensated by the advertisers that appear on the website, based on your interaction with the advertisements or advertisers.
© 2007-2024 - Fusion Media Limited. All Rights Reserved.