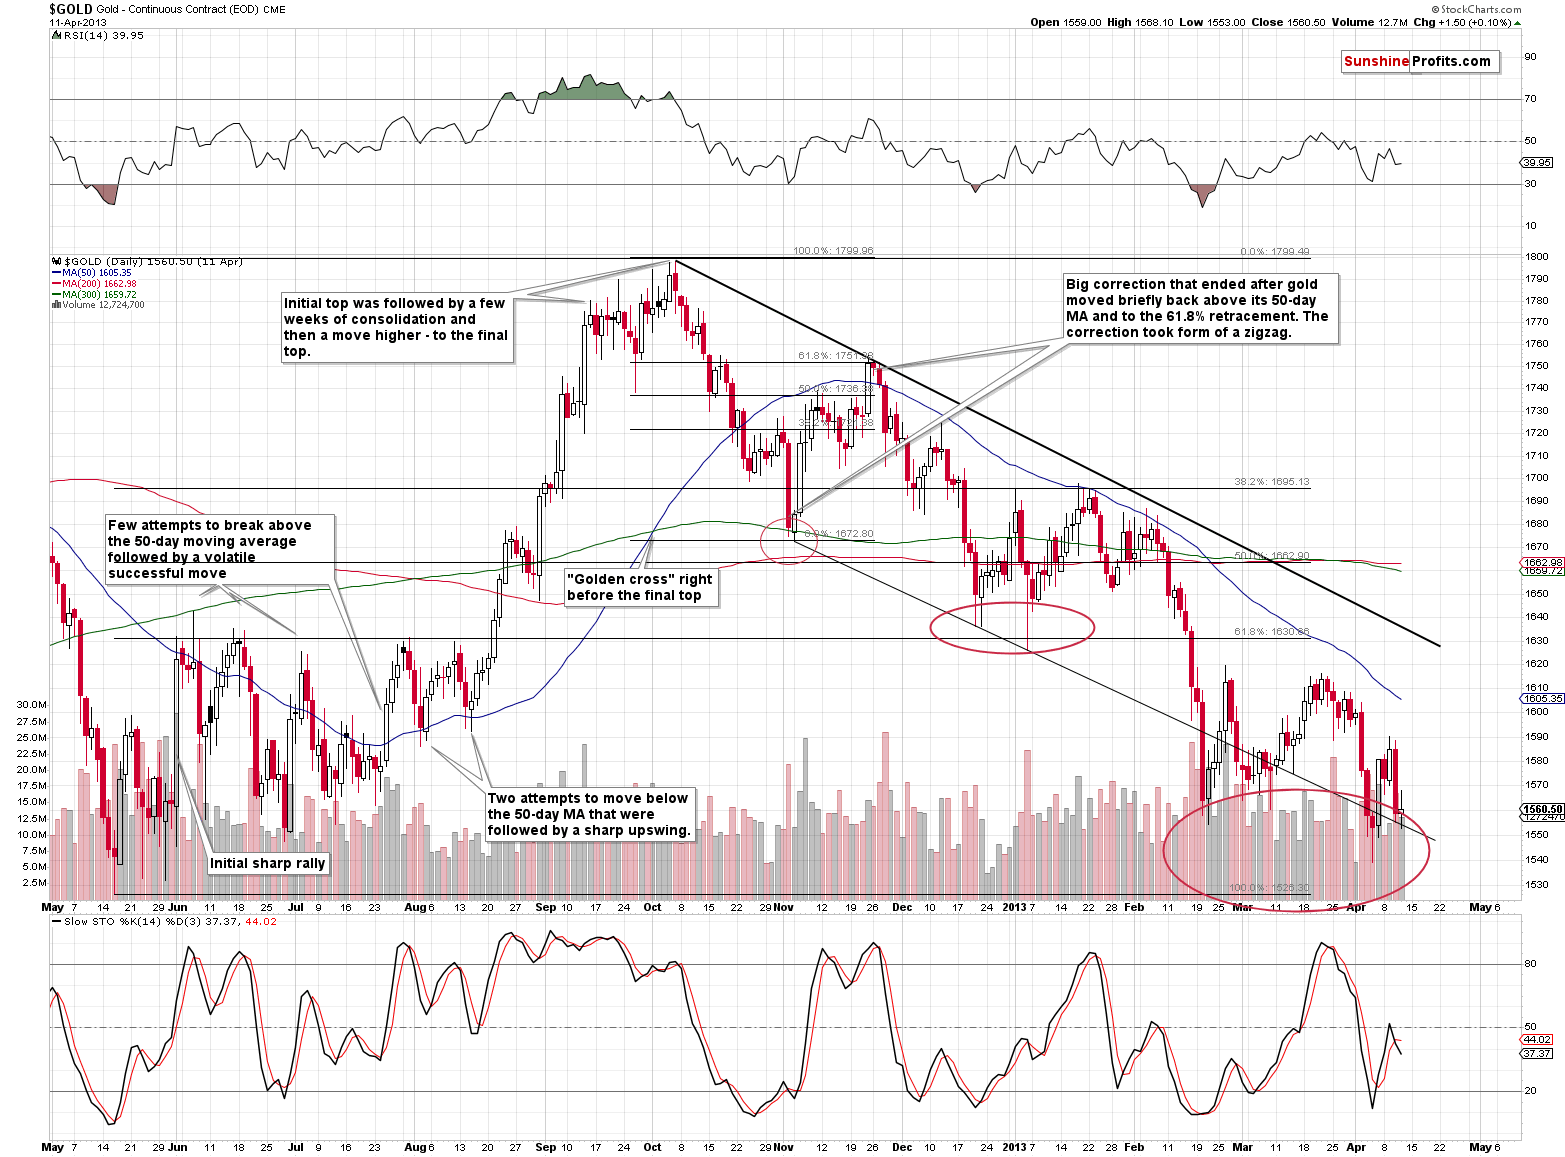
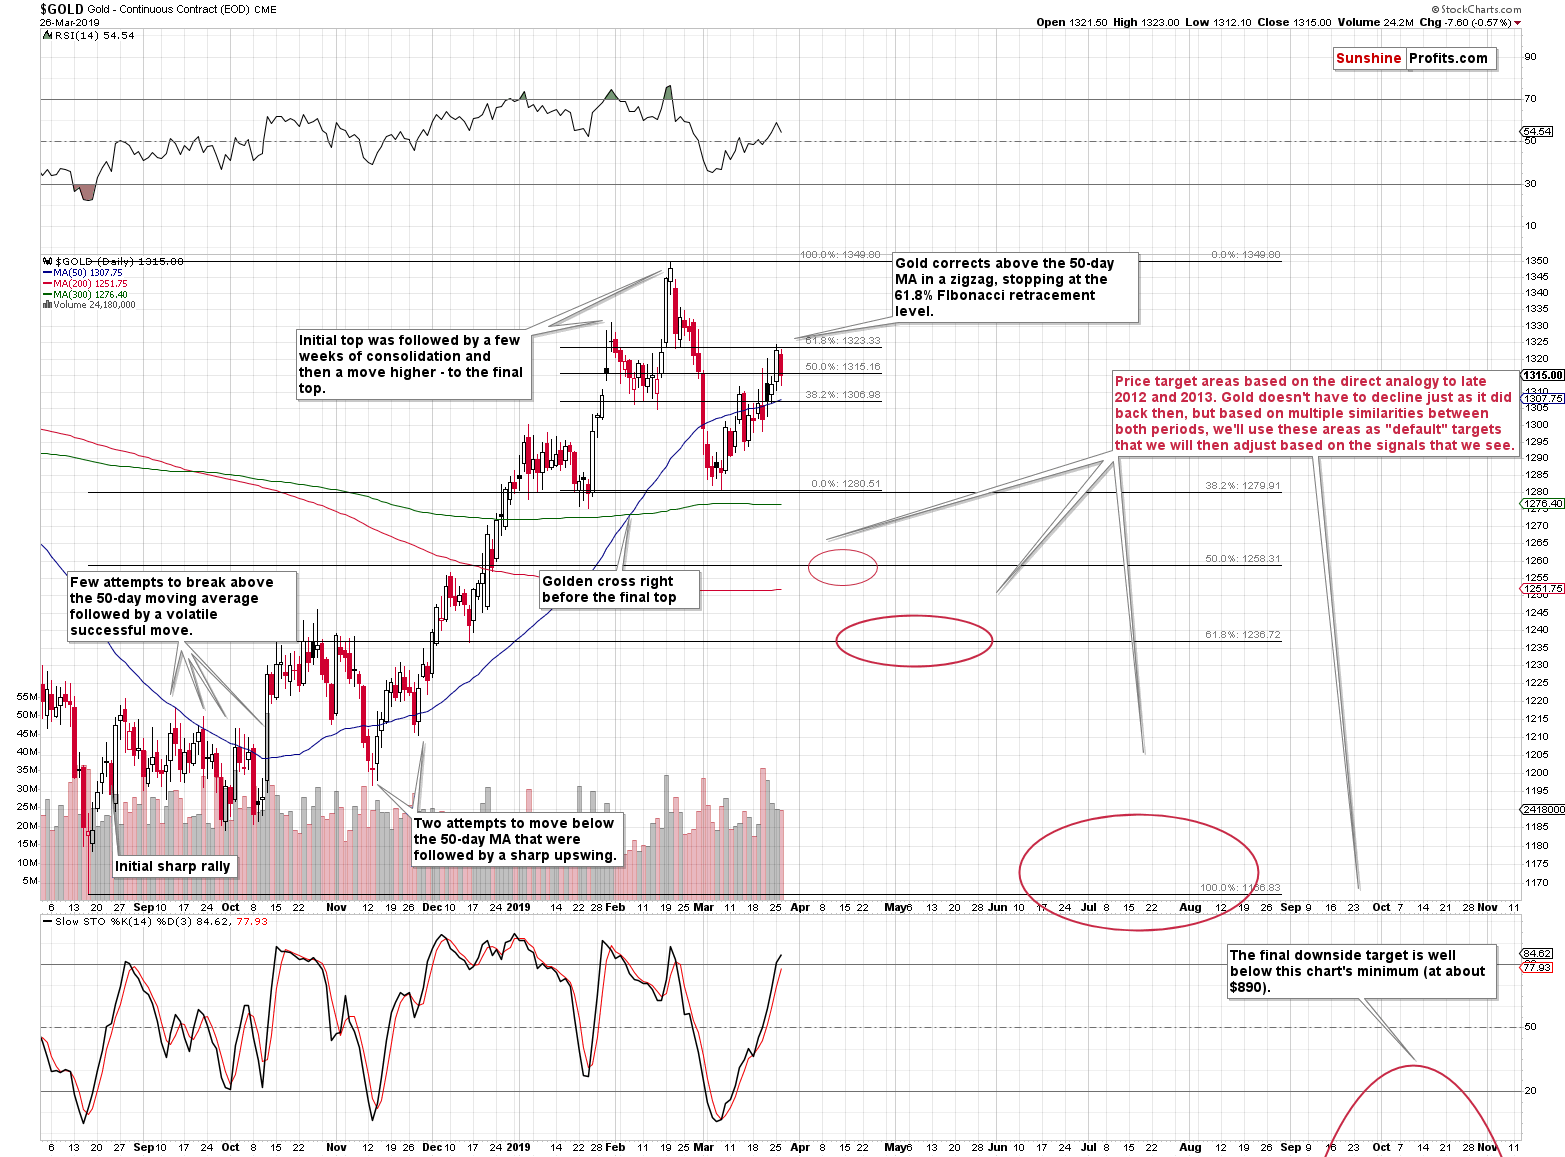
We previously wrote about the situation being similar to 2012 with regard to overall price movement in gold and in particular with regard to the 61.8% Fibonacci retracement that has been just reached. The yellow metal declined by a few dollars Tuesday, just like it did after topping out in November 2012. Higher prices were never seen since that time, which means that there was no single day giving a better opportunity to sell gold. But… Gold miners just moved higher, even though gold declined, which is a classic buy sign.
The devil is in the details. The miners moved higher, but barely so. The move higher in the HUI Index was less than half of one percent and the GDX ETF was up by just 9 cents. It’s a rally, but a tiny rally. And… What happened right after the 2012 top in gold that we described previously?
The 2012-2013 – Now Link: The Topping Action In Gold And Gold Miners
The top that we described on Tuesday formed precisely on November 23, 2012. On the following session – November 26, 2012, gold declined. But what did the mining stocks do on November 26, 2012?
They all declined initially but rallied before the end of the session. The HUI Index closed just 0.17% lower and the GDX ETF was up by 1 cent – a tiny rally. This post-top day in gold was very similar on both occasions. In case of the HUI Index, the November 23, 2012 session was the one that was the final top, and in case of the GDX ETF, the final top formed on November 26, 2012.
The link remains intact and the implications remain bearish.
Gold Miners Review: The Cost Of Capital Implications Of The Fed U-Turn
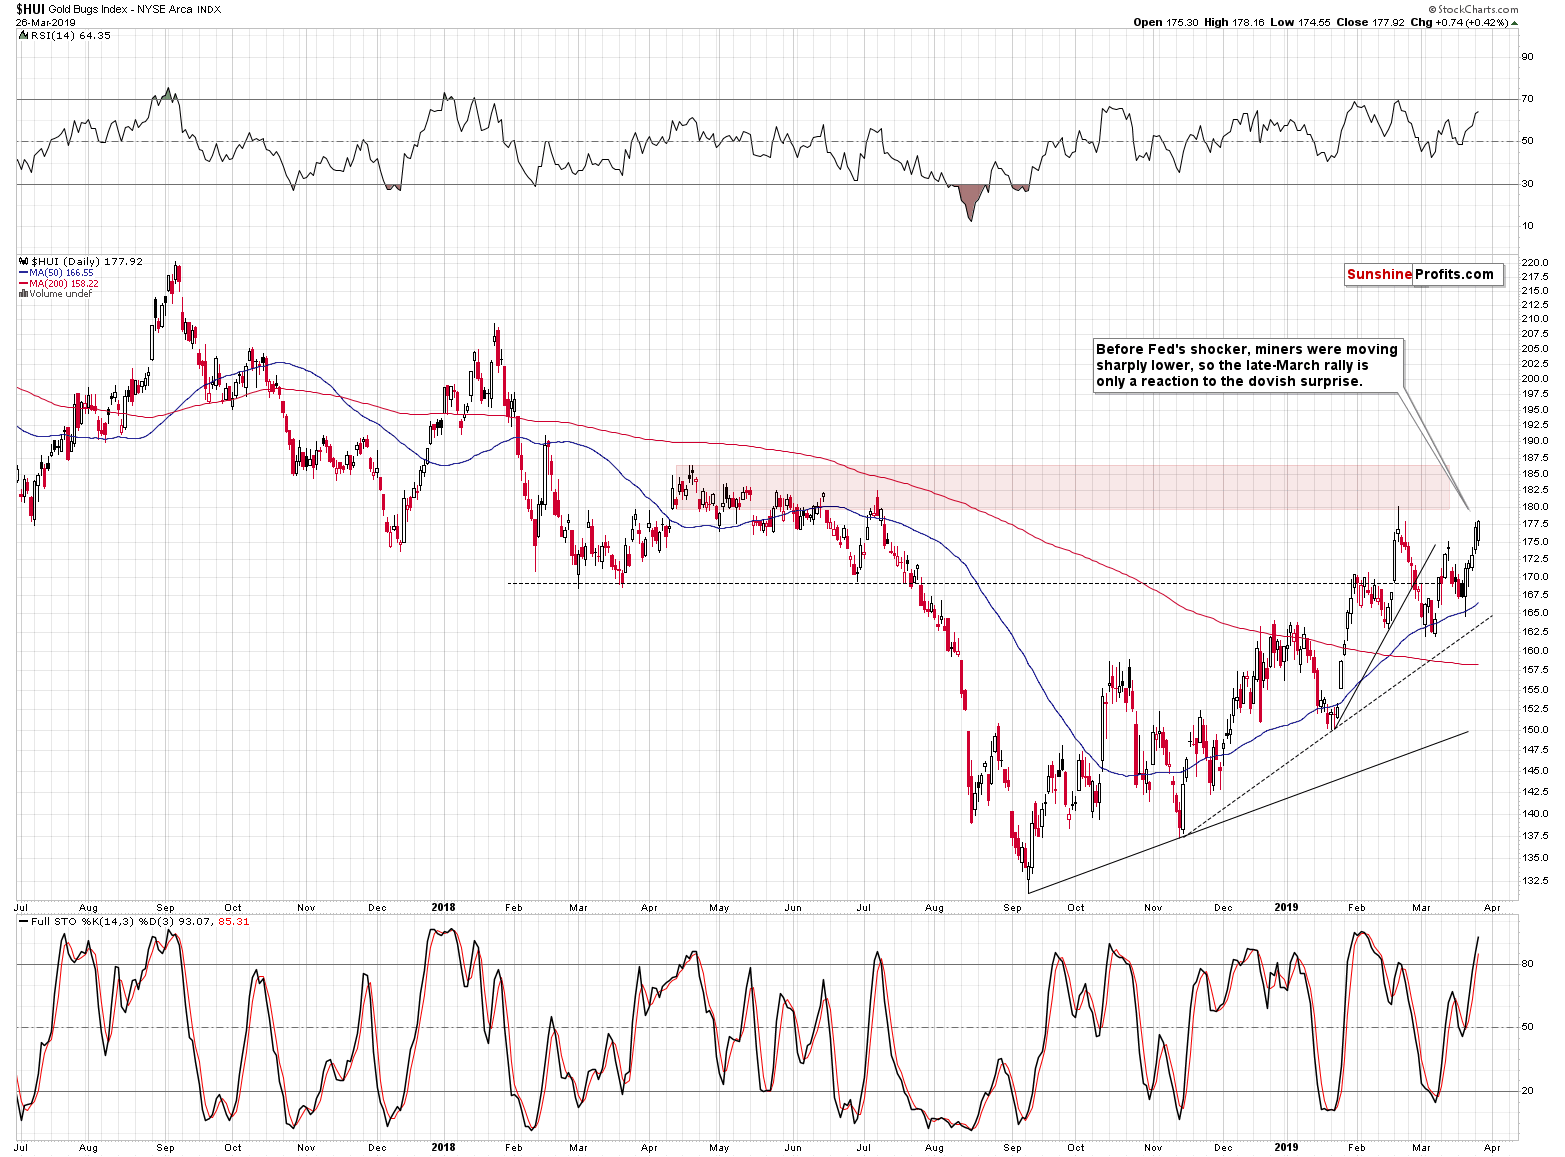
The most notable development that took place recently was the dovish surprise from the Fed. Out of the entire precious-metals market, miners were declining most profoundly right before the Fed surprised the markets. They really wanted to slide. The reaction of the entire precious-metals sector to the Fed’s announcement was weak, but the reaction of mining stocks appears stronger than the one from silver and gold. Is there any meaningful reason for that, or is this simply a sign of strength of the miners?
Let’s see… What is the one key benefit that is always mentioned when someone is advocating investing in physical metals? That’s it’s nobody else’s liability. And you know what companies – including mining stocks – have? Liabilities. Companies, including miners, finance their operations with debt. Of course, not only with debt, but also with shares, private placements and so on, but the debt is one of the instruments company management can – and does – use to raise capital.
More dovish Fed means better terms at which companies might finance their operations. The implications of the Fed’s surprising change in policy are more meaningful for mining stocks than they are for the underlying metals. Consequently, it’s normal for the miners to react in a more meaningful way to the prospect of a loosening monetary policy. Taking the above into account, miners’ reaction was still relatively weak.
Consequently, in light of both: based on the strength of the miners’ reaction to the Fed’s interest-rate announcement, and the analogy to what happened in late November 2012, it doesn’t seem that Tuesday’s strength of the mining stocks relative to gold should be taken at its face value.
Gold stocks moved a bit above the highest closing price of February, but the breakout is definitely not confirmed so far, so it’s not really meaningful. And the odds are that it will be invalidated, instead of being confirmed.
Let’s check how much changed from the long-term point of view.
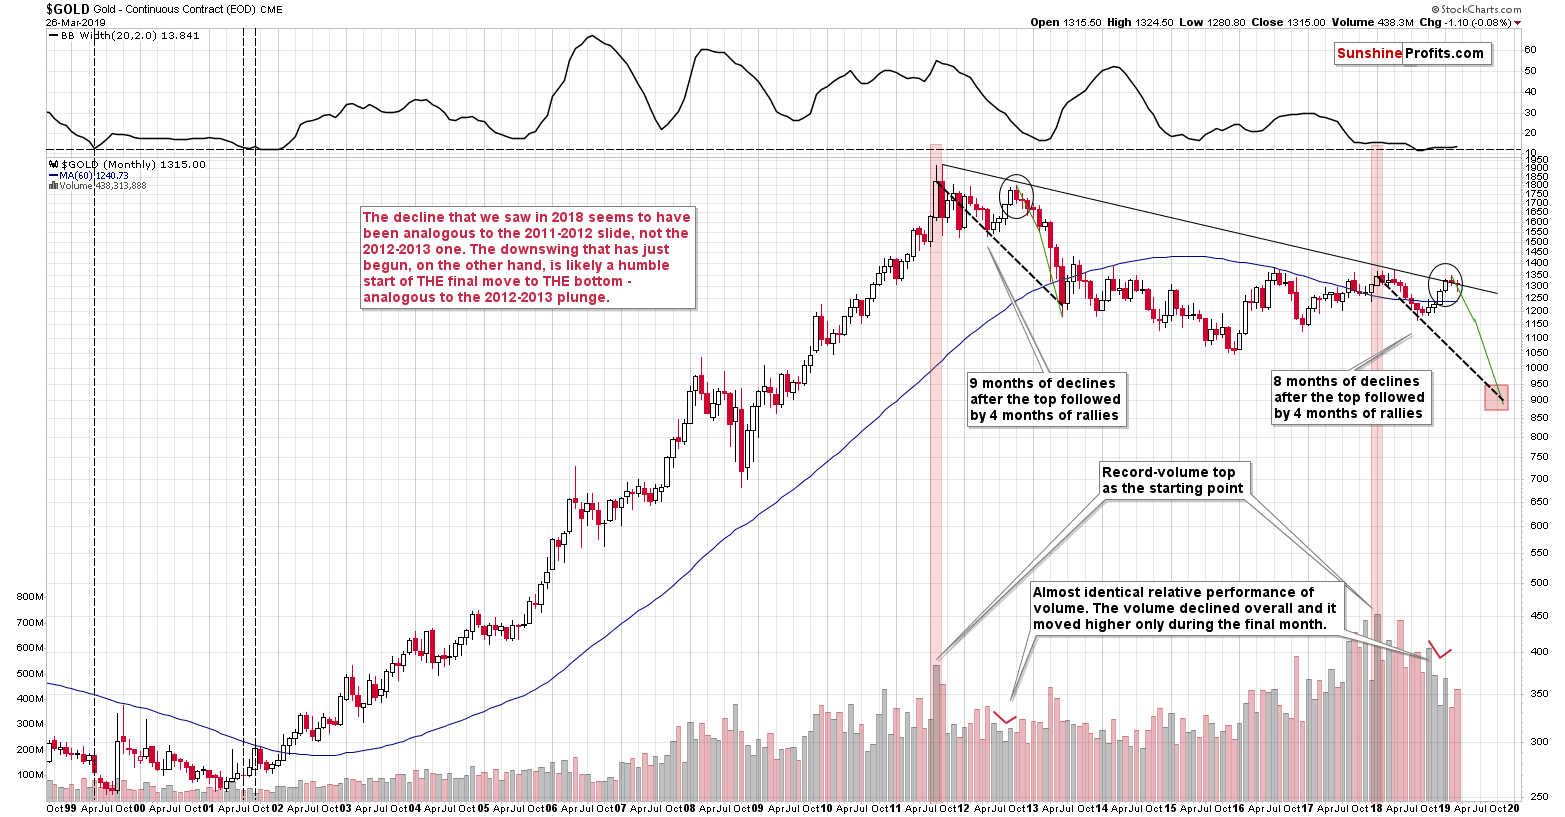
Practically nothing. The second month of declines in late 2012 was the one when there were moves up and down, but overall gold didn’t move much lower on a closing basis. We can say something similar about March. Gold is down just $1 this month, which fits the above analogy very well. If it wasn’t for the Fed’s shocker, we would have probably seen lower gold prices instead. In this way, gold would have caught up with the pace of decline from late 2012, when in the first one to two months of the decline, it erased its last month of gains. Then again, we still have four more sessions left in March, so gold might still move lower after all, catching up with the average monthly pace of the decline that we have witnessed in 2012.
Gold, Japanese Yen And The USD Index
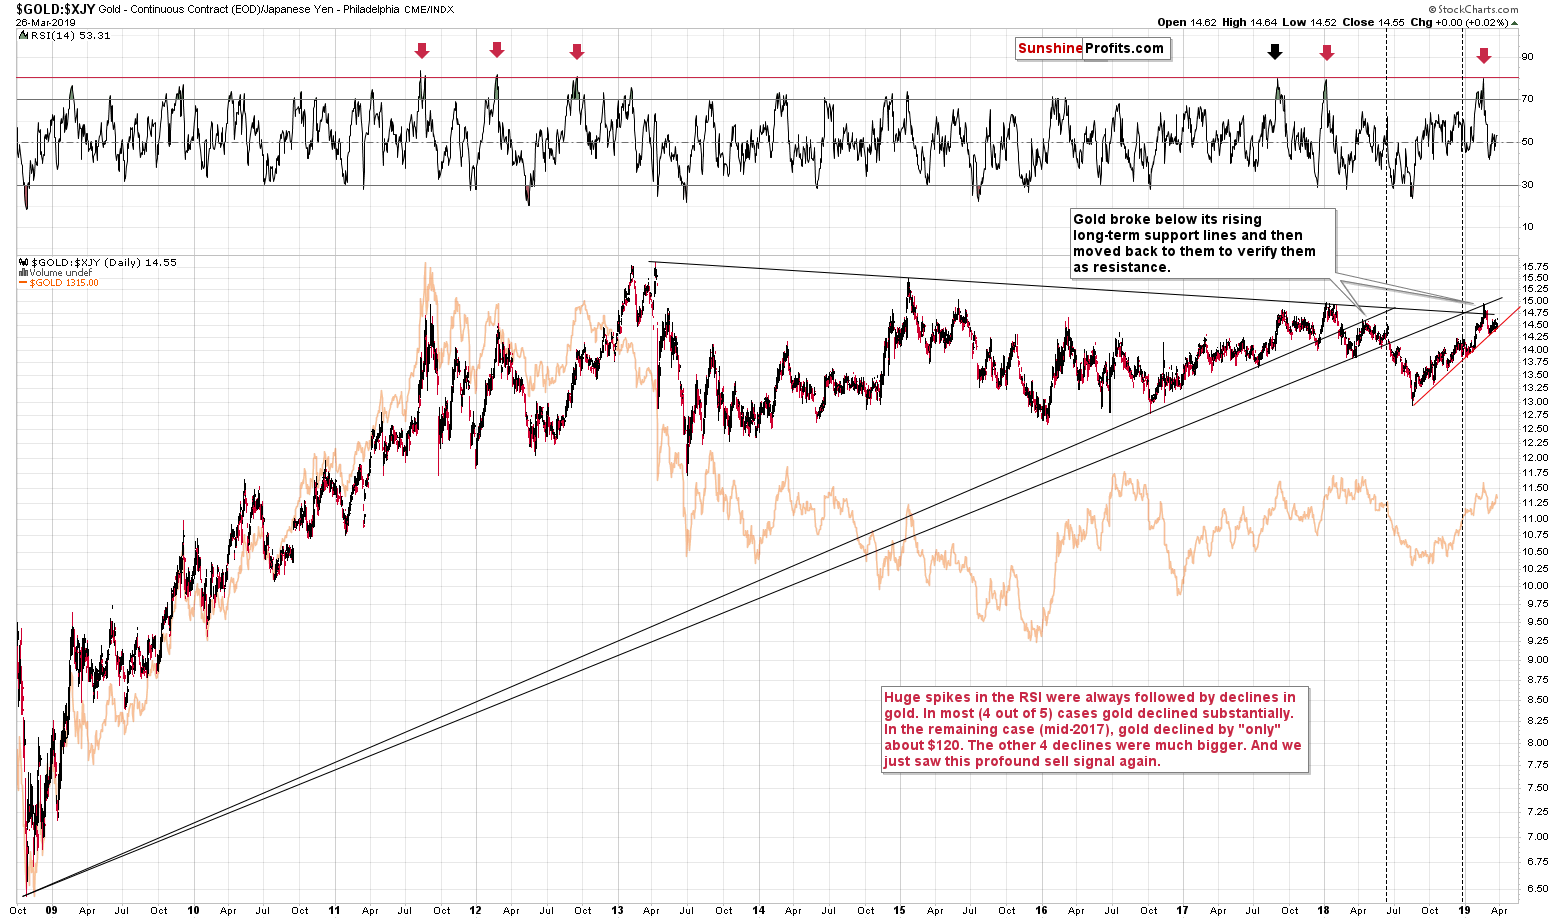
Looking at gold’s price in terms of the Japanese yen, we see that gold is currently trading very close to its rising red support line based on the previous lows. The lows are more aligned to the rising line in case of the yen perspective, than in the case of our regular USD view, so any breakdown here is likely to be quite meaningful.
And we are likely to see one based on the factors that we are writing about today, and what we have discussed previously. In particular, please note that gold’s reaction to the moves in the USD Index may be delayed, but it’s extremely unlikely to be absent. And the USD Index has practically already told us what it’s about to do next.
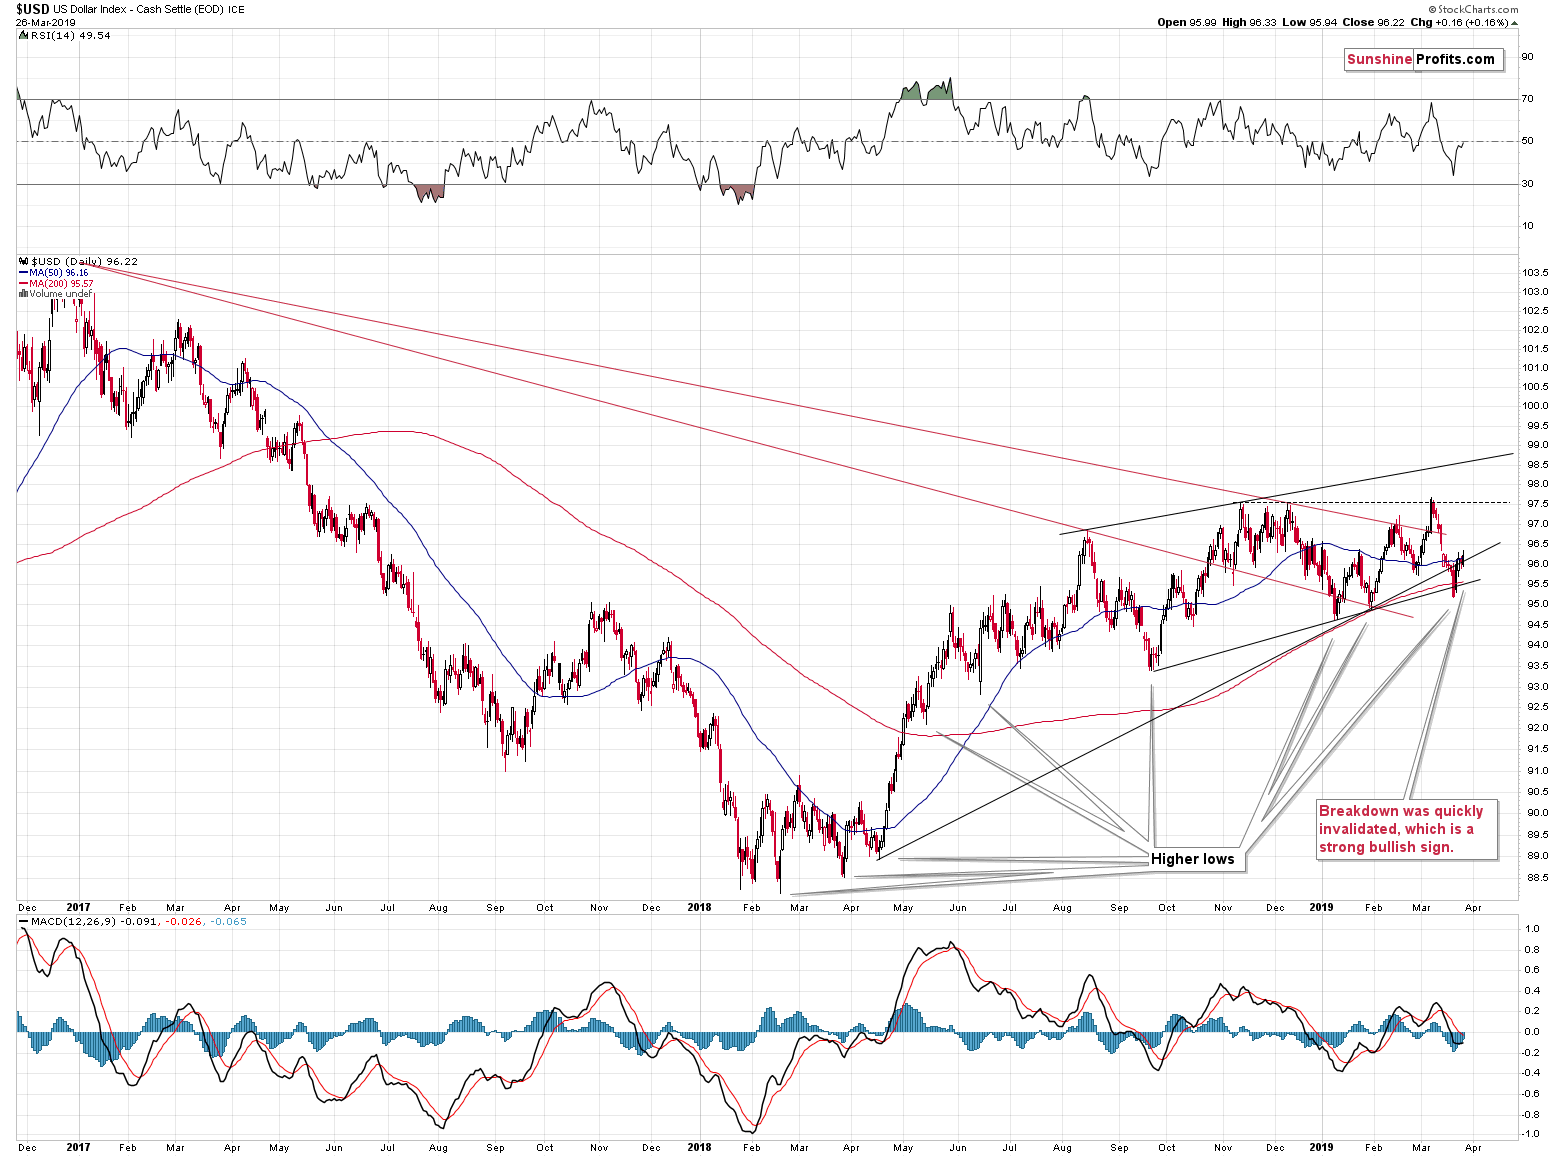
The US currency is already higher than it was before the Fed announced the change in its policy. Such a change should have sent the USD much lower, just like it did very initially. If the USD Index resisted such a massively bearish signal, then what could really prevent its rally? It’s almost inevitable – like a coiled spring.
Technicals confirm it as well. Invalidations of breakdown are very strong bullish signs and we recently saw two of them. One support line was based on the April 2018 low and the late-January 2019 low and the other one was based on the September 2018 low and the January 2019 lows. The USD Index moved below both of them and then rallied back up – despite the Fed’s announcement. This is a profoundly bullish sign for the US currency.
Summary
Summing up, the medium-term trend for gold appears to be down based on all the signals. It looks to be a natural part of a bigger move lower and not a beginning of any move higher – notwithstanding the short-term strength in the miners.

