Get 40% Off
⚠ Earnings Alert! Which stocks are poised to surge?
See the stocks on our ProPicks radar. These strategies gained 19.7% year-to-date.
Unlock full list

USD/CHF Moves Sideways, EUR/USD Declines

Published 08/18/2015, 05:20 AM
Updated 07/09/2023, 06:31 AM

USD/JPY

Nothing changed during the previous four trading days, as the range remains very tight.
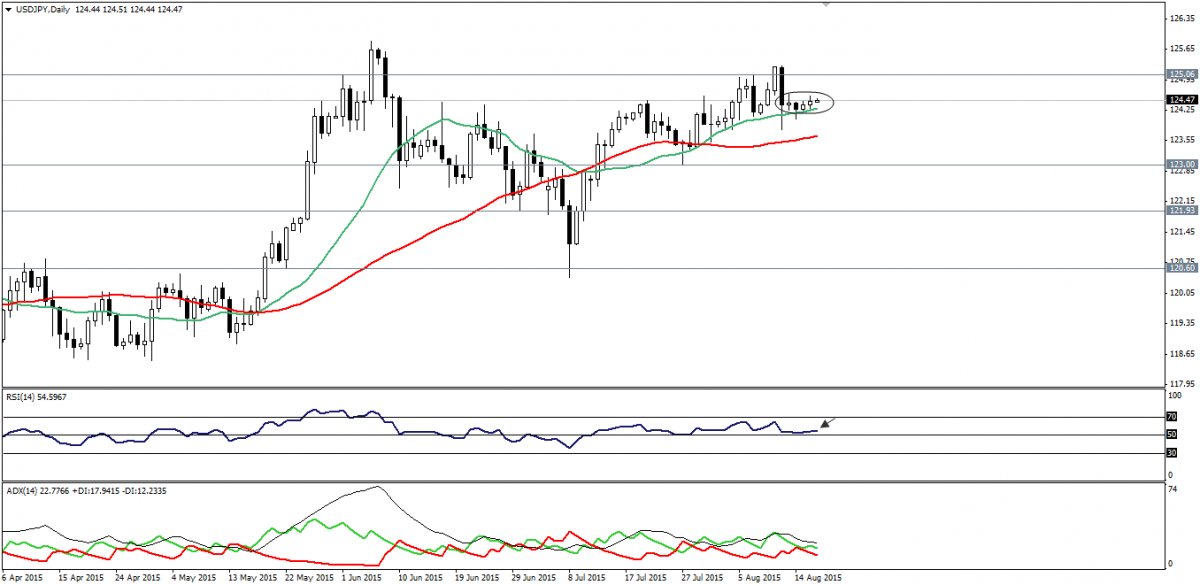
USD/JPY Daily Chart

USD/JPY continues to move above SMA20, while RSI is still moving sideways.

We remain neutral, waiting for a new signal to enter the market, as the USD/JPY should give off a reliable factor to assist us to suggest potential direction.

Support: 124.00-123.80-123.20

Resistance:125.00-125.50-125.80

Direction: Sideways

USD/CHF

USD/CHF is still moving sideways between 61.8% Fibonacci and 76.4% Fibonacci, but some kind of bullish tendencies have been witnessed above SMA20.
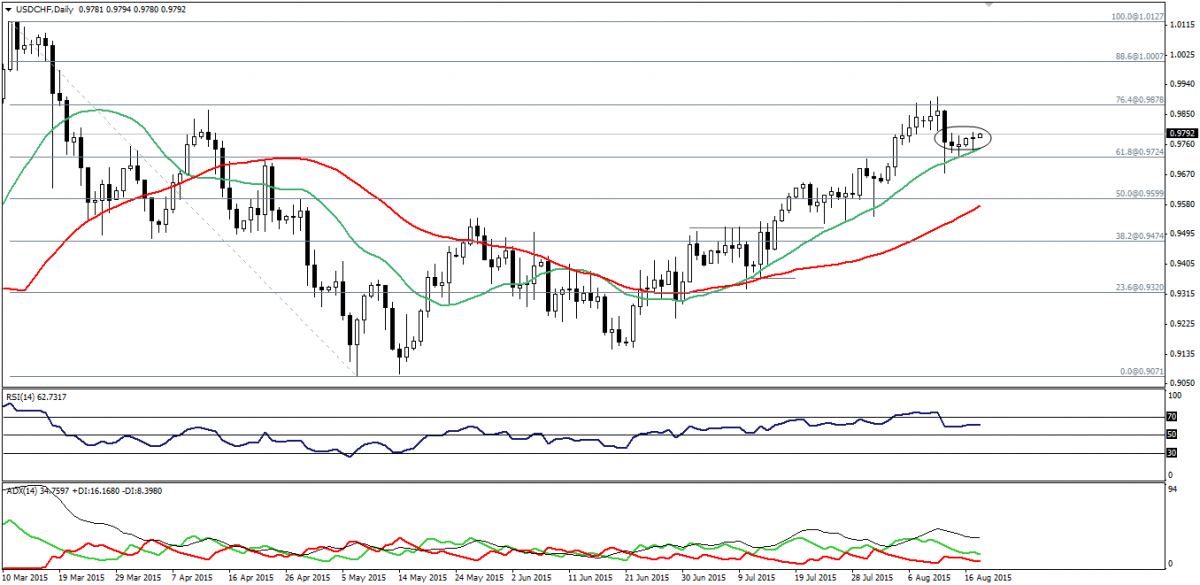
USD/CHF Daily Chart

We will follow bulls once the USD/CHF succeeds in taking out 0.9860, as a breakout above this level will weaken 0.9880 pivotal resistance.

On the other hand, coning below 0.9725 will be a negative signal over short-term basis.

Support: 0.-9765-0.9725-0.9680.

Resistance: 0.9830-0.9880-0.9905

Direction: Neutral

EUR/USD

EUR/USD declined, influenced by facing 1.1110, which could bring more negative pressures, but the pair approaches 1.1030 support and 1.10 psychological.
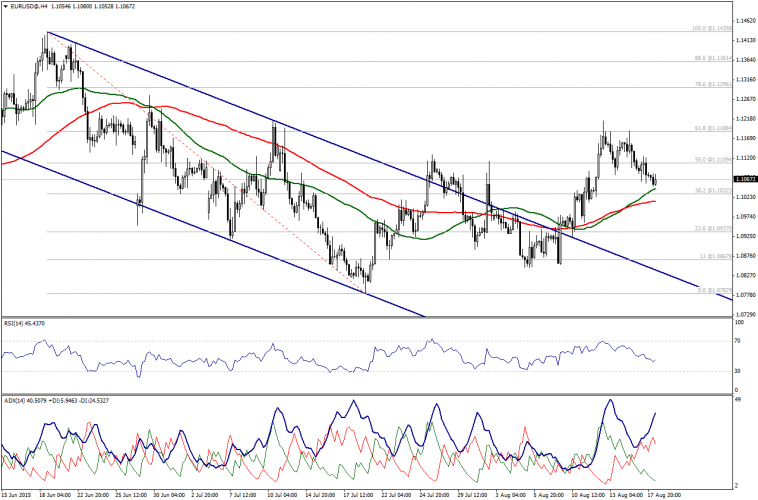
EUR/USD 4 Hour Chart

Moving averages offer support to traders despite negativity on RSI and ADX.

Risk versus reward is good and therefore, we suggest potential upside recovery as far as 1.0980 holds.

Support: 1.1030 – 1.1000 – 1.0980

Resistance: 1.1085 – 1.1110 – 1.1185

Direction: Up

GBP/USD

Following the CPI data, GBP/USD inclined sharply breaching 1.5630 and that suggest more upside actions. However, we need another breakout above 1.5700 to confirm the current bullish attempt.

Of note, a break above 1.5700 will bring a re-test of 1.5800.

GBP/USD has declined sharply after failing to breach through 1.5700 and the strength of the bearishness increased with a break below 1.5630. Now, the pair is approaching 1.5555.
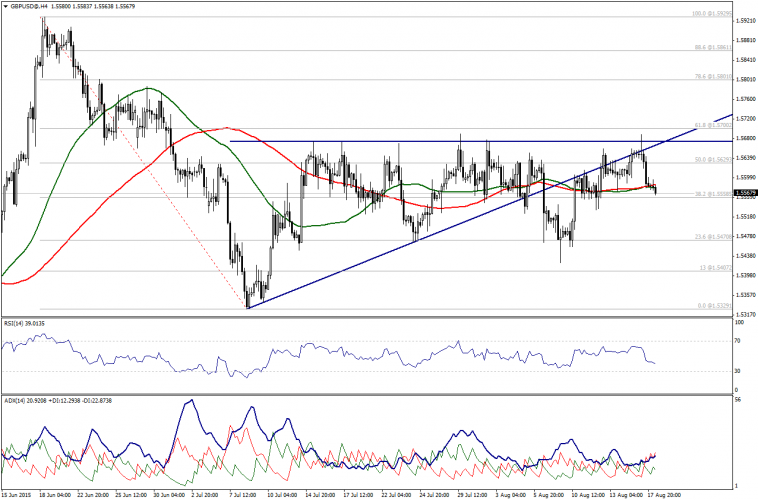
GBP/USD 4 Hour Chart

Trading below moving averages would bring bearish actions, but a breakout below 1.5555 is required to affirm the negativity that will be valid as far as 1.5630 holds.

Support: 1.5555 – 1.5500 – 1.5470

Resistance: 1.5600 – 1.5630 – 1.5680

Direction: Down with confirmation below 1.5555.

Latest comments

Risk Disclosure: Trading in financial instruments and/or cryptocurrencies involves high risks including the risk of losing some, or all, of your investment amount, and may not be suitable for all investors. Prices of cryptocurrencies are extremely volatile and may be affected by external factors such as financial, regulatory or political events. Trading on margin increases the financial risks.
Before deciding to trade in financial instrument or cryptocurrencies you should be fully informed of the risks and costs associated with trading the financial markets, carefully consider your investment objectives, level of experience, and risk appetite, and seek professional advice where needed.
Fusion Media would like to remind you that the data contained in this website is not necessarily real-time nor accurate. The data and prices on the website are not necessarily provided by any market or exchange, but may be provided by market makers, and so prices may not be accurate and may differ from the actual price at any given market, meaning prices are indicative and not appropriate for trading purposes. Fusion Media and any provider of the data contained in this website will not accept liability for any loss or damage as a result of your trading, or your reliance on the information contained within this website.
It is prohibited to use, store, reproduce, display, modify, transmit or distribute the data contained in this website without the explicit prior written permission of Fusion Media and/or the data provider. All intellectual property rights are reserved by the providers and/or the exchange providing the data contained in this website.
Fusion Media may be compensated by the advertisers that appear on the website, based on your interaction with the advertisements or advertisers.
© 2007-2024 - Fusion Media Limited. All Rights Reserved.