Rather than more extended narrative, and with a fairly quiet start to the week, I have put out a collection of charts that have grabbed my eye this afternoon.
1) Is this December 2017 all over again? Déjà vu anyone?
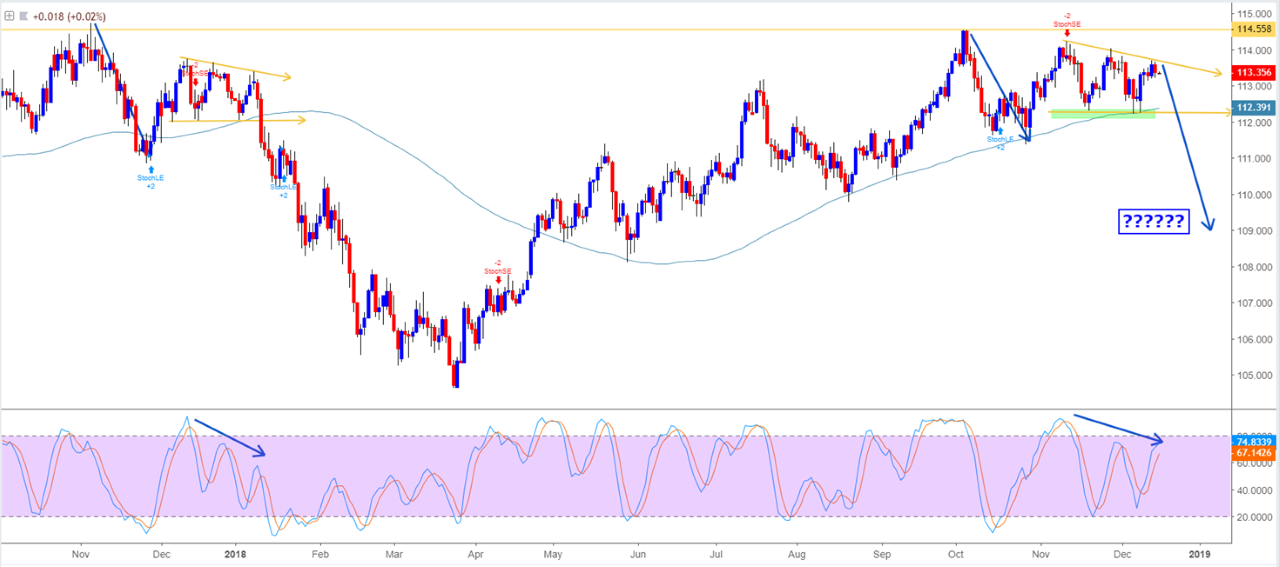
That daily chart of USD/JPY shows a set-up that is remarkably similar to price action seen through November 2017. Where, after a sell-off and reversal, price consolidated in a triangle pattern. In both cases, we can see stochastic momentum making a series of lower highs, and should price now find sellers off trend resistance the first target is ¥112.25, where a close through horizontal support could suggest USD/JPY could genuinely shape up for a re-run of 2017.
There is little doubt USD/JPY would be lower than current levels if it weren’t for the massive $81b inflows into US Money Market funds seen last week (source: Lipper). With such intense tightening of US financial conditions, equity volatility and dovish re-pricing of US interest rate expectations, one would assume USD/JPYshould be trading closer to ¥112. However, when everyone is piling into the safety of short-term debt markets and Japanese investors are buying USD-denominated assets unhedged, the USD is holding up well.
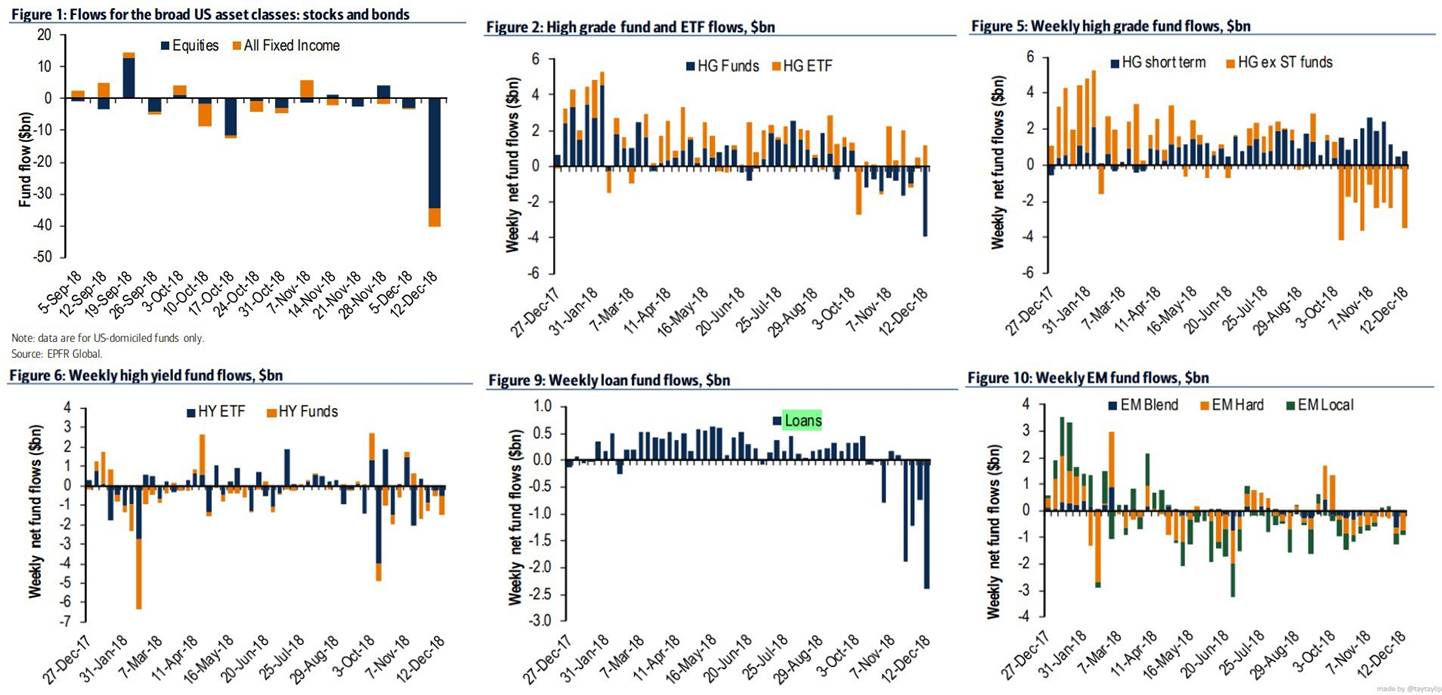
2) Weekly fund flow data – last week was an exodus from risk assets
As we can see there was a record withdrawal from equity and fixed income funds last week. There was also a record withdrawal from high yield and loan funds. What this fund flow data doesn’t show is the $81b inflow into US money market funds, which is a sign of a bid for cash assets and is no doubt a reason why the USD was strong last week.
2) The USD index – pushing strong resistance
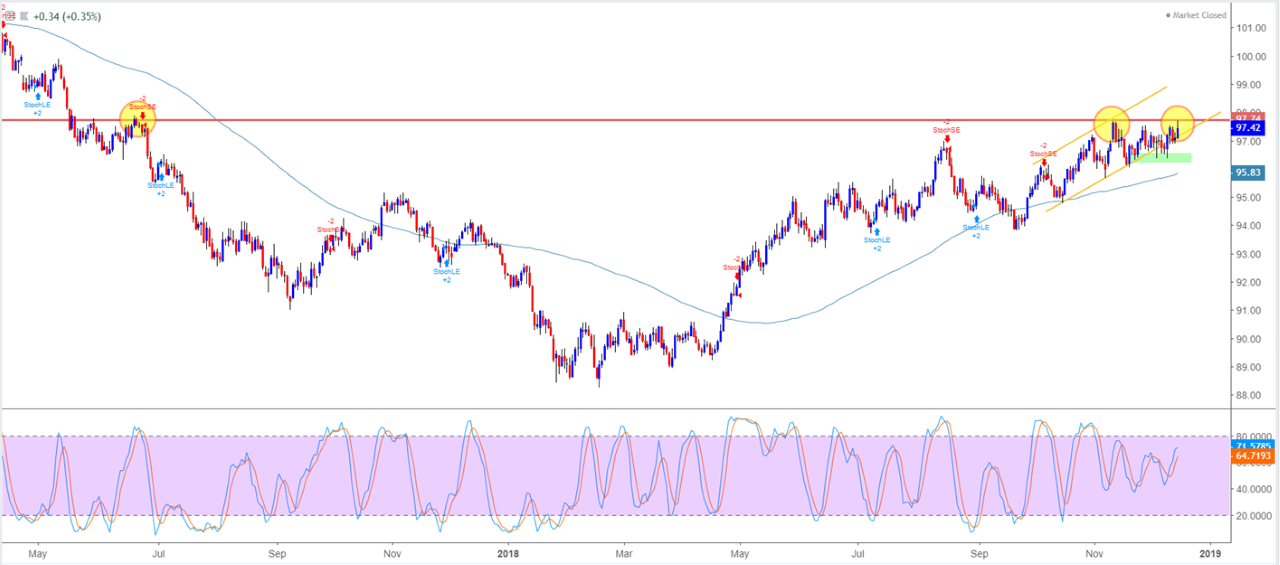
Poor European composite PMI data on Friday caused the USD basket to strengthen into 97.70, which as we can see is a huge barrier and should be on FX traders’ radar. With the Fed meeting this Thursday (06:00aedt), naturally the USD is in play, and should we see a weekly close through 97.70 then the USD could head into 100.00. Of course, if the Fed produces a dovish hike, with less optimistic rhetoric on the domestic and global economy that alarms, then price could easily roll over. Although, the preference is short USD/JPY and long EM FX in this scenario.
3) USD positioning ahead of the December FOMC meeting
Non-commercial accounts have been reducing USD exposures, but only modestly. The market is still very much net long USDs, but futures positioning is not currently at extremes.
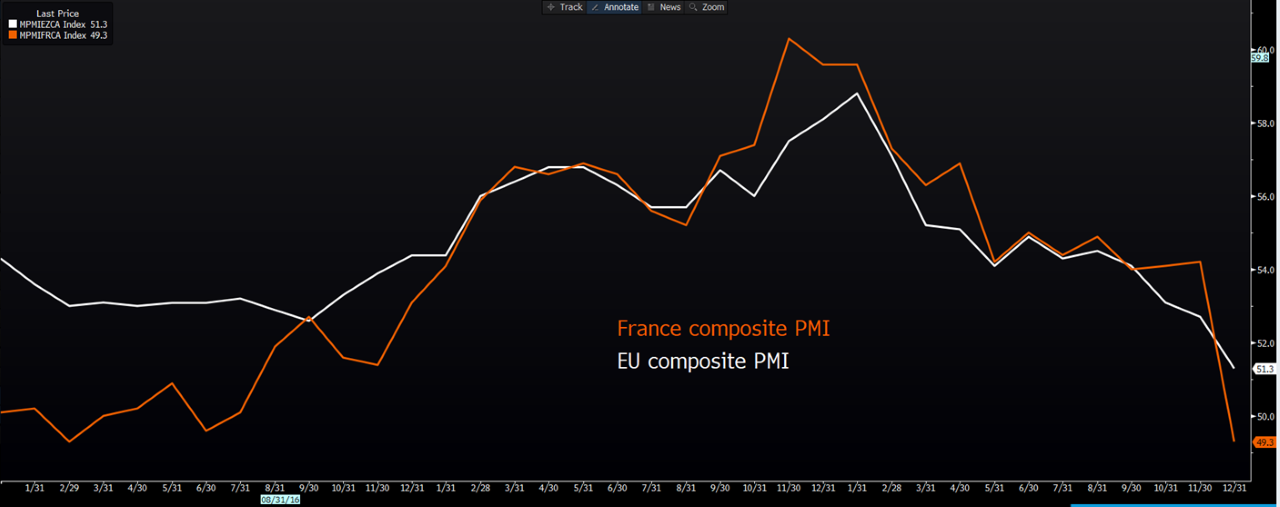
4) Terrible Eurozone (EZ) data
It's still too hard to buy EUR/USD (on a timeframe over four-hours) when we see EZ composite (manufacturing + services) PMI trending lower like this. French composite PMI had a genuine shocker, with the new orders sub-component printing 48.5 – the lowest level since November 2014. And, keep in mind we haven’t seen the impact from the Yellow Vest protests yet.
All eyes now fall on tomorrows German IFO business survey (20:00aedt), where any further deterioration seen in the survey will likely add to the worries of a slowdown in the EZ economy. Let’s not forget that on Friday we saw China November retail sales print 8.1%, while industrial production came in at 5.4%. These were the lowest levels since 2003 and 2008 respectively. This worrying growth dynamic takes on even more importance ahead of this week’s China’s annual economic conference.
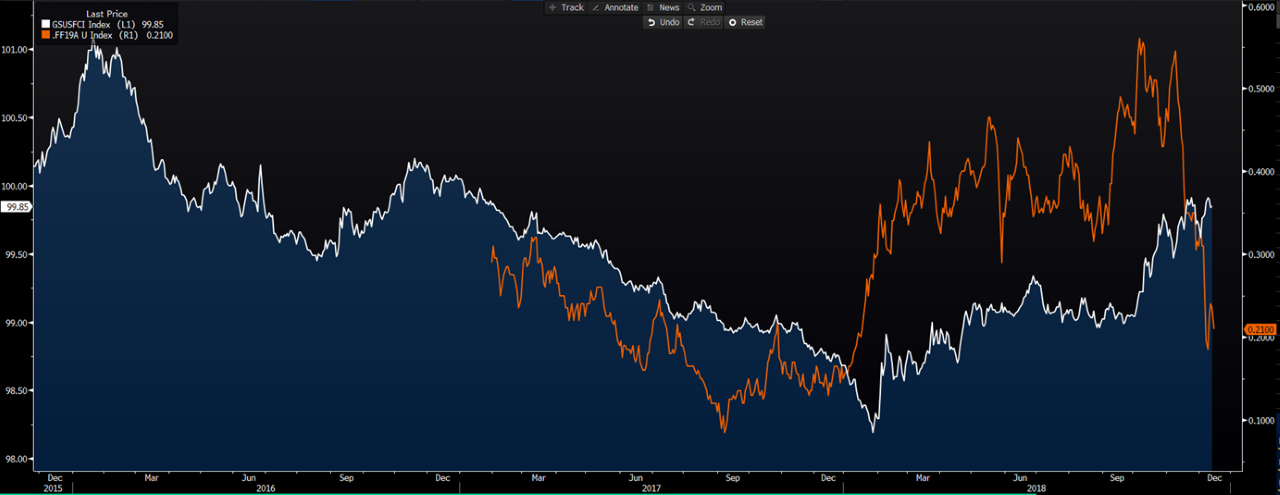
5) Why hike when the markets are doing all the heavy lifting for the Fed?
- Orange line - US interest rate pricing in 2019
- White line – Goldman Sachs financial conditions index
High volatility, a sharp drawdown in equity and higher LIBOR rates (among other variables) are impacting broad financial conditions, and interest rate hikes have responded. With 23bp of hikes priced now priced for 2019, have they gone too far?
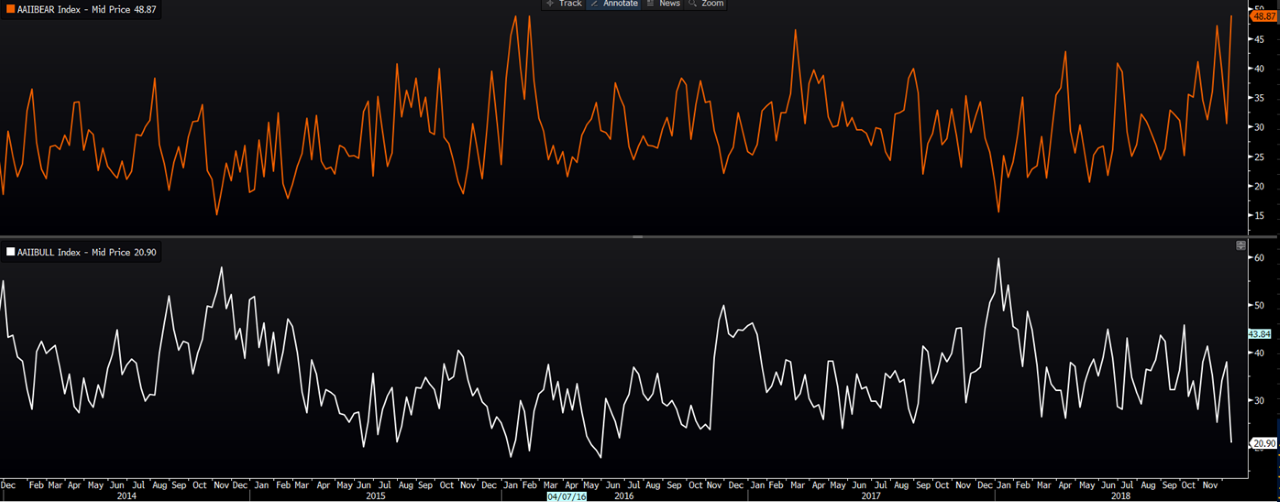
6) Are we too pessimistic?
Aside from the huge outflows from risks assets last week (see point 2), we can look at technical oscillators, amid other indicators. However, the weekly AAII US investors survey also caught my eye. The top pane shows those who consider themselves as bearish, the lower, those who are bullish equities. ‘Buy when others are fearful’ a wise man once said. That said, I am not convinced at this juncture, but acknowledge sentiment is very sour.
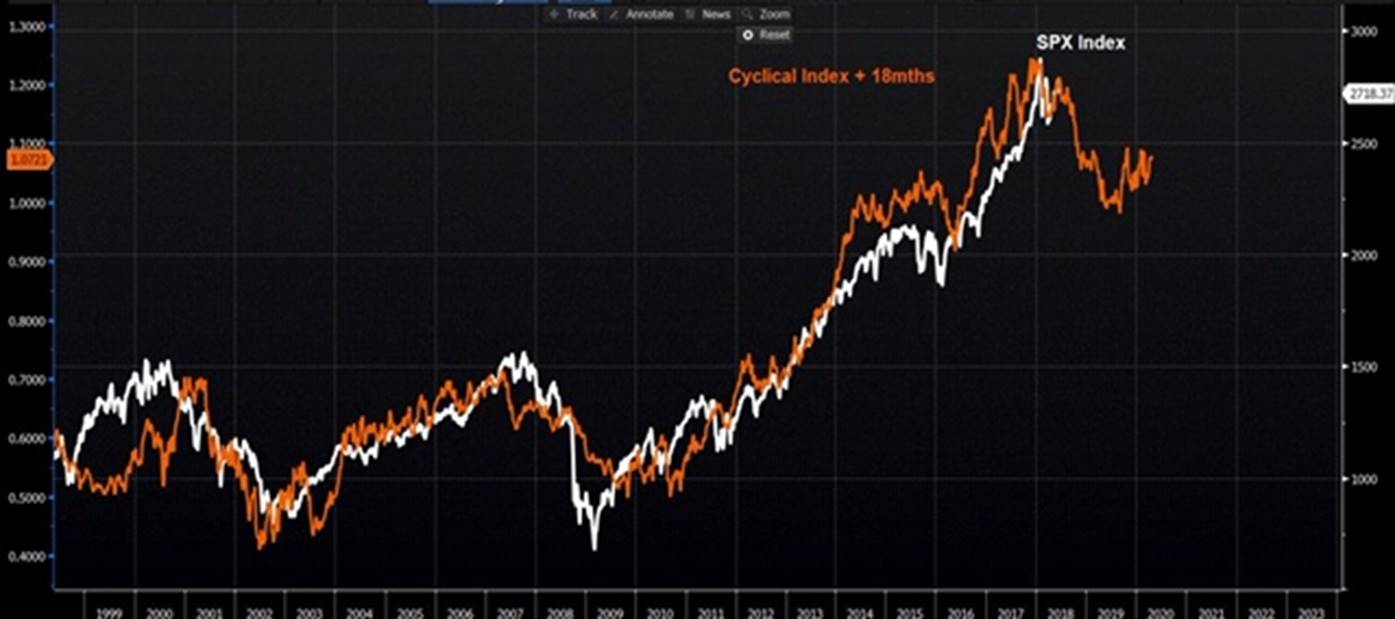
7) Look out downside in stocks?
From a post (on Twitter) from Julian Brigden (@JuianMI2), which shows his cyclical model (I’m not sure of the inputs) put forward by 18 months, overlapped with the S&P 500. The model effectively leads equities by 18 months, needless to say, the correlation is strong and suggests a move into 2400 and perhaps 2200.
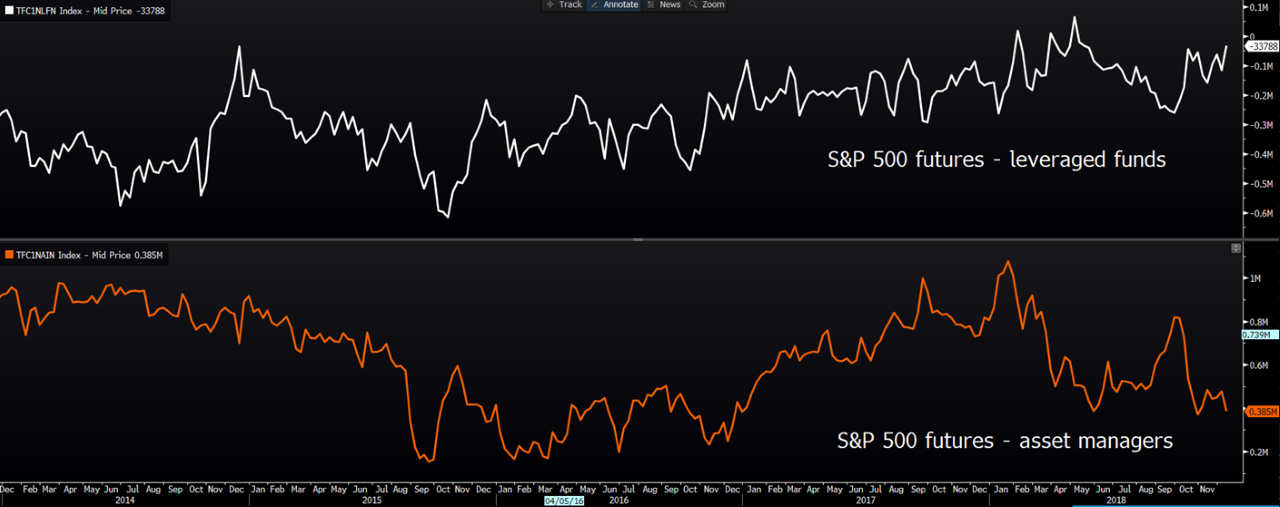
8) S&P 500 futures positioning
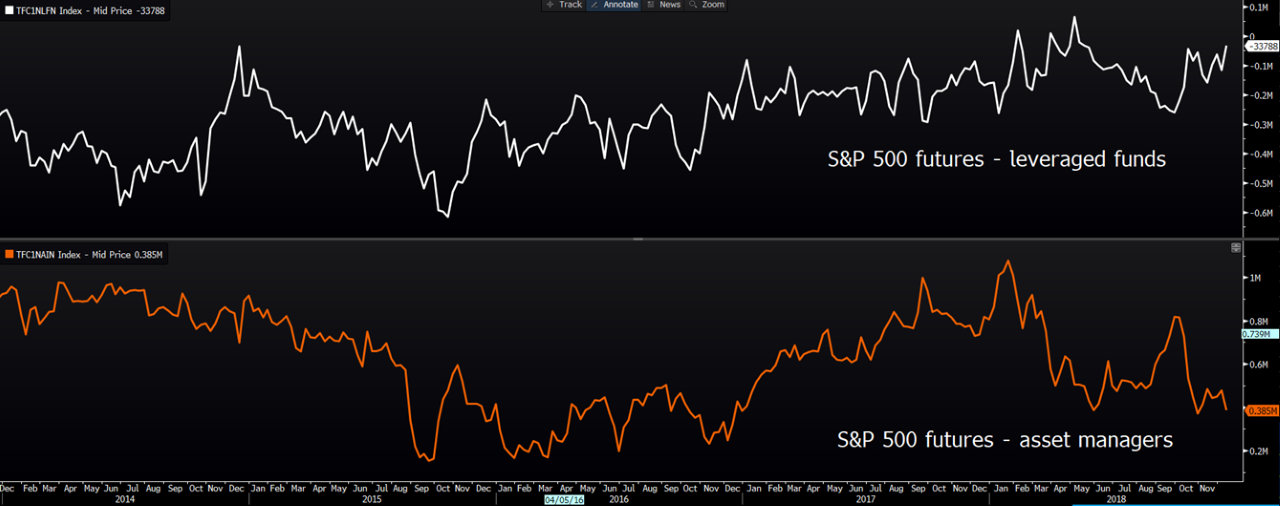
As of Tuesday (when the positioning is reported), we have seen leveraged funds (hedge funds) part cover S&P 500 futures shorts. That said, given the sell-off in equity markets from Tuesday, one suspects hedge funds would hold a more substantial short position at this juncture, but the trend has been to cover shorts here. The opposite is true of asset managers, who hold a net long position, although, this has been reduced of late.
