
With little economic data to move the markets yesterday, the main focus was increasing fears about emerging markets. Tensions in Ukraine continue increase as German Chancellor Merkel reported called Russian actions in Crimea an annexation and said Russia must switch course in the region by next week or risk more sanctions. The EU will discuss harsher sanctions on 17 March, the day after a planned referendum in Crimea on whether to join Russia. Sanctions on Russia would no doubt be met with counter-sanctions. All in all they would be a negative for global trade and growth.
China is also troubling the markets. There were rumors that another Chinese solar company would announce a default. Central Bank Gov. Zhou suggested that the fluctuations in the yuan recently were within a reasonable range, which implies that the government is not perturbed by this volatility and it’s likely to persist. The Chinese rumors, while unconfirmed, affected the commodity markets and copper fell a further 3.25%, dragging the AUD down below 0.90 again with it.
AUD was the worst-performing G10 currency overnight as risk aversion came back into fashion, while safe-haven JPY, the reverse of that trade, was the best performing one. Otherwise USD was virtually unchanged against the G10 currencies compared with yesterday morning’s rates. On the other hand, it gained against all 15 EM currencies that we track, led by ZAR. TRY was the second-worst performing EM currency after a teenager injured during a police crackdown last year died, triggering protests in Istanbul.
The collapse in copper affected oil prices as well, and the rout in commodities dragged US stocks down too. Oil and gas were the worst-performing sector, followed by basic materials and industrials, as one would expect in a market driven by fears of a slowdown in global growth. The slowdown in Chinese growth is causing oil demand there to slow and increasing the amount of Chinese exports of refined products, which is depressing oil prices globally.
I expect that the tensions in Ukraine will only increase as the referendum approaches, while the unravelling of the Chinese credit bubble is just getting started. Hence I think these trends are likely to continue and indeed intensify. AUD seems vulnerable to me, as does CAD as oil prices start to be dragged down with metal prices. The SNB’s intervention means that JPY is likely to respond more to safe haven demand than CHF. AUD/JPY would be one way to play the slowdown in the Chinese economy.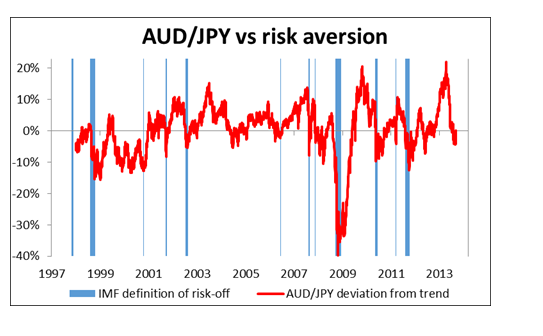 AUD/JPY vs. Risk Aversion" title="AUD/JPY vs. Risk Aversion" width="474" height="242" />
During the Asian morning, it was announced that Japan’s Tertiary industry index rose 0.9% mom in January, beating estimates of a 0.6% mom rise. Concerns over China trumped this news however and stocks fell. In Australia, home loans were unchanged in January, disappointing expectations of a 0.5% mom rise, and perhaps contributing to the decline in AUD.
The European day today is fairly quiet. We have only the Eurozone’s industrial production for January and the US MBA mortgage applications for the week ended on March 7. Eurozone industrial production is forecast to have risen 0.5% mom in January after declining 0.7% in December, driving the yoy rate up to +1.9% from +0.5%.
Wednesday’s schedule includes four ECB speakers. The European Central Bank Governing council member Luis Maria Linde speaks in Spain, while the European Central Bank Executive Board members Peter Praet, Benoit Coeure and Yves Mersch speak at a conference on “The ECB and Its Watchers.”
Then late Wednesday, the Reserve Bank of New Zealand will hold its monetary policy meeting. This should be a landmark meeting as the RBNZ is expected to be the first G10 central bank to raise rates during the current easing cycle. It’s widely expected to raise its official cash rate by 25 bps to 2.75%. In fact another rate hike within the year is already priced in. Given the widespread expectations of a hike, the response of NZD depends on what comments Gov. Wheeler makes following the meeting and how quickly and how far he sees the rate rising.
 EUR/USD Hour Chart" title="EUR/USD Hour Chart" width="474" height="242" />
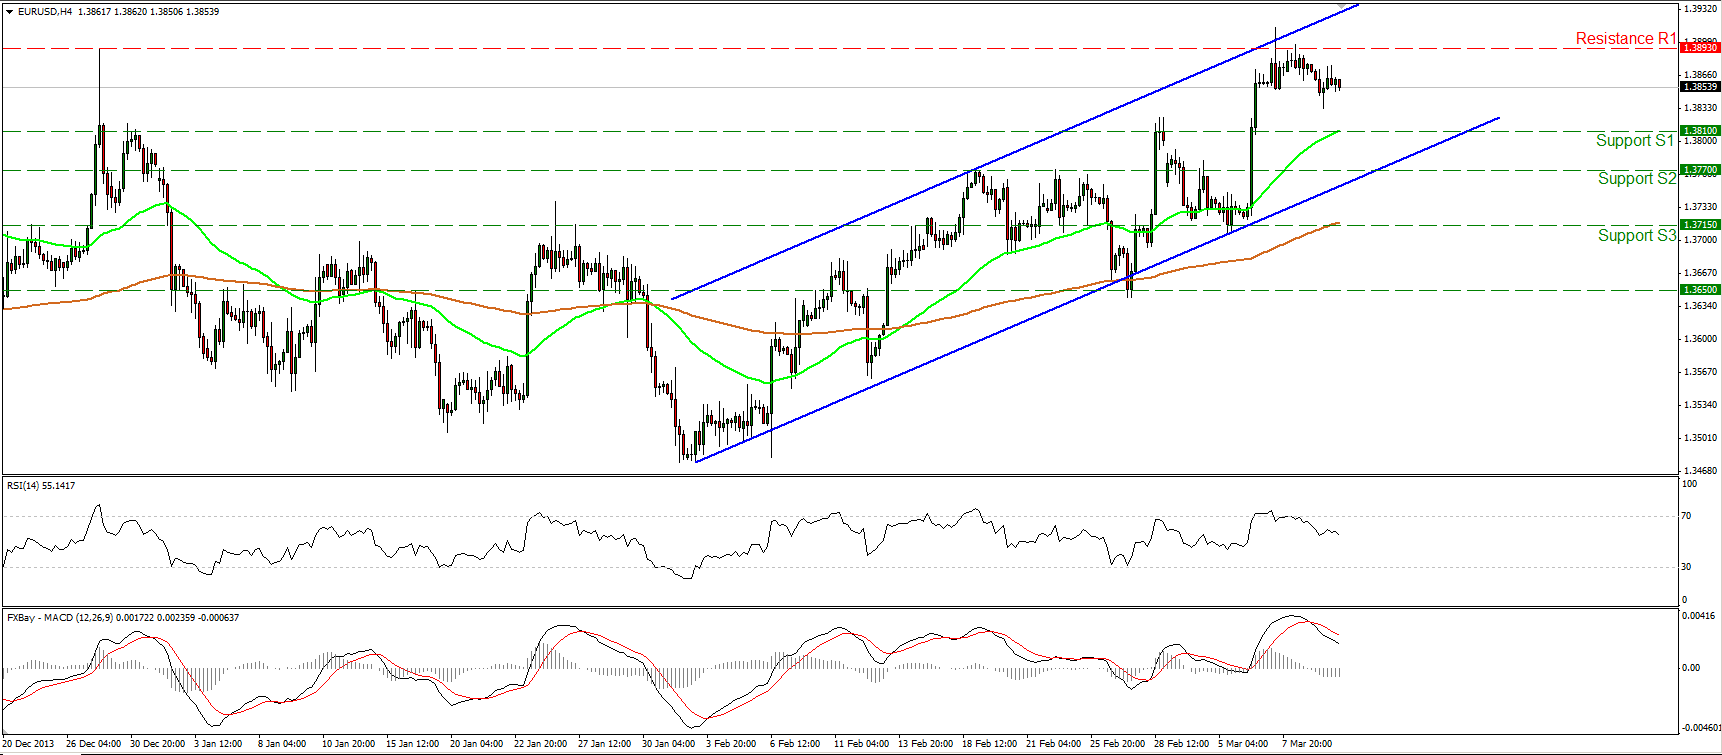
The EUR/USD moved lower as expected, remaining between the support of 1.3810 (S1) and the resistance at 1.3893 (R1). Considering the downward slope of both our momentum studies and the fact that the MACD remains below its signal line, my view remains the same as yesterday. I would expect the downward corrective wave to continue, perhaps to test the 1.3810 (S1) area as a support this time. However, the structure of higher highs and higher lows remains in progress thus I consider the short-term path to be to the upside. In the bigger picture, a clear close above the 1.3893 (R1) would signal the continuation of the longer-term uptrend and have larger bullish implications.
• Support: 1.3810 (S1), 1.3770 (S2), 1.3715 (S3).
• Resistance: 1.3893 (R1), 1.4000 (R2), 1.4200 (R3).
 EUR/JPY Hour Chart" title="EUR/JPY Hour Chart" width="474" height="242" />
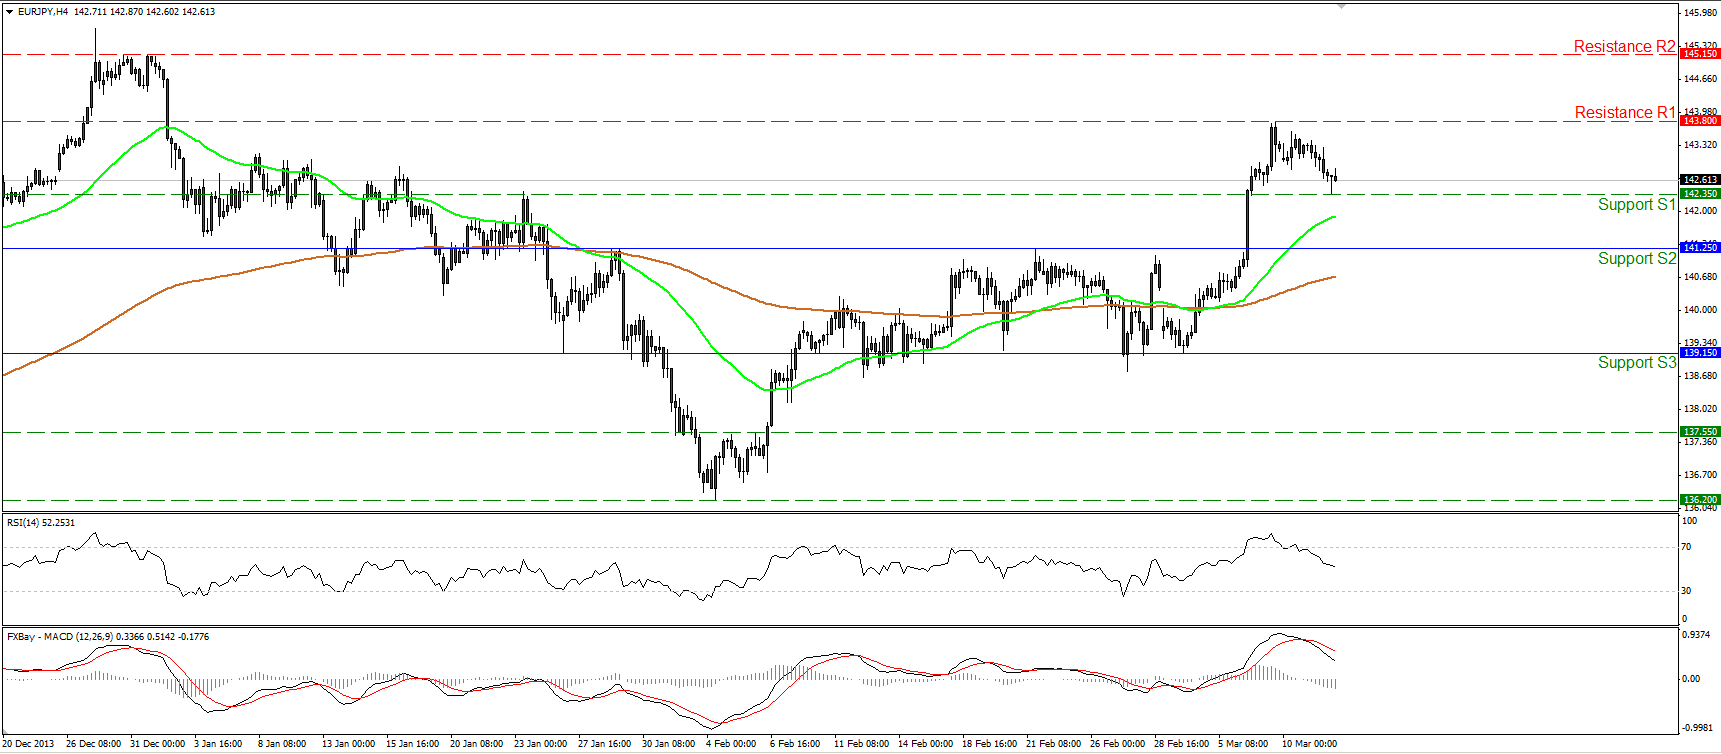
The EUR/JPY continued retracing and found support at 142.35 (S1). Considering the negative slope of our momentum indicators and the fact that the MACD remains below its trigger, a fall below that bar cannot be ruled out. Nonetheless as long as the rate is trading above the upper boundary of the recent trading range, I consider the picture to be mildly positive and the current decline as a corrective movement.
• Support: 142.35 (S1), 141.25 (S2), 139.15 (S3)
• Resistance: 143.80 (R1), 145.15 (R2), 147.00 (R3).
 GBP/USD Hour Chart" title="GBP/USD Hour Chart" width="474" height="242" />
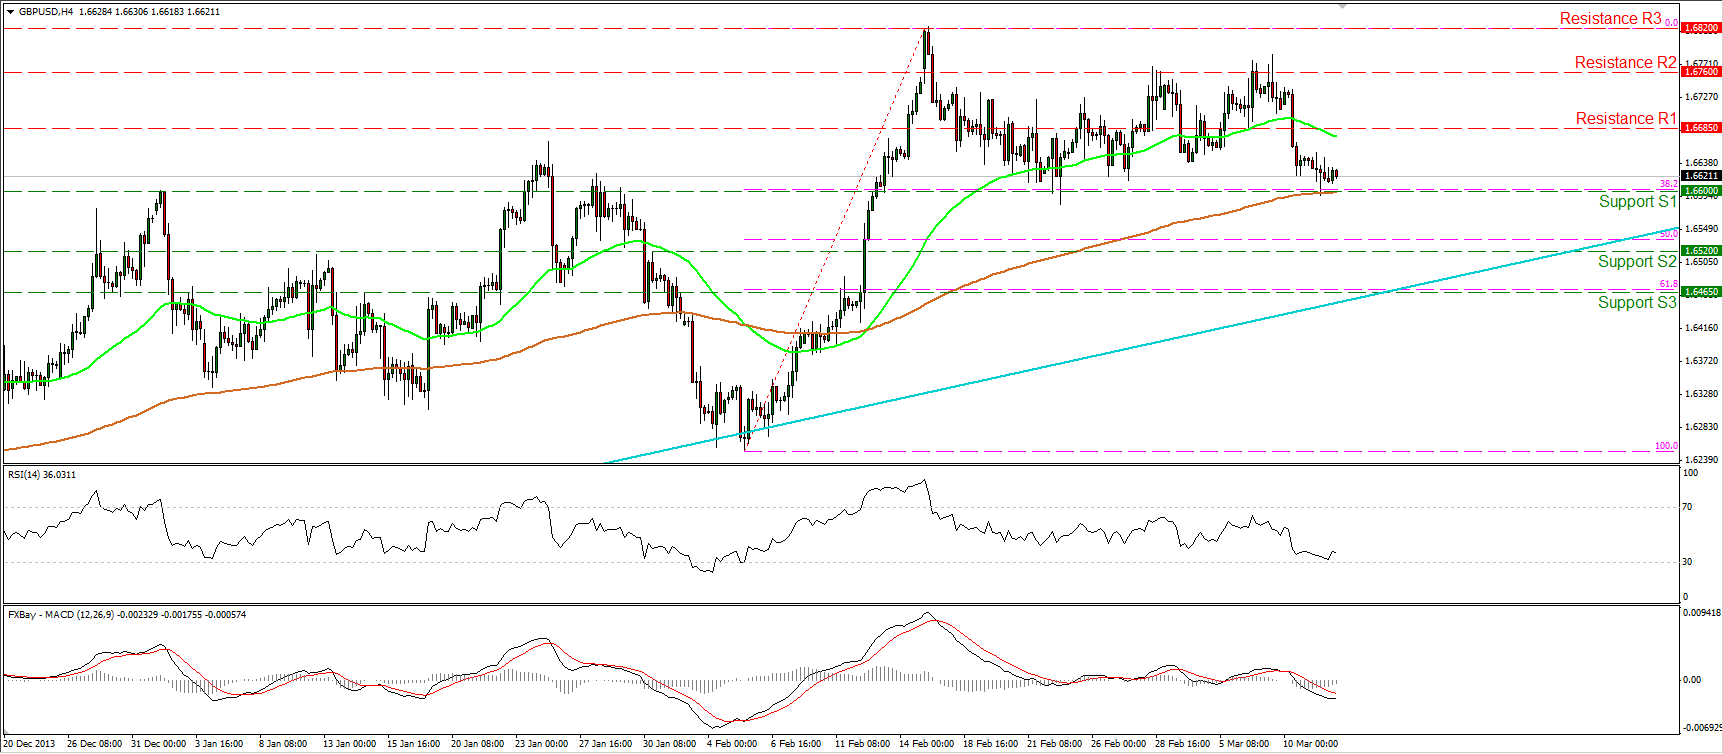
The GBP/USD fell below the 1.6685 (R1) bar, but the decline was stopped by the 1.6600 (S1) key support, which coincides with the 38.2% retracement level of the 5th – 17th Feb. rally, and the 200-period moving average. A fall below the 1.6600 (S1) may extend the correction towards the 50% retracement, near the 1.6520 (S2) support. In the bigger picture, as long as the rate is trading above the long-term uptrend (light blue line), I consider the major upward path to remain intact. However, a decisive break above the highs at 1.6820 (R3) is needed to confirm the resumption of the larger uptrend.
• Support: 1.6600 (S1), 1.6520 (S2), 1.6465 (S3).
• Resistance: 1.6685 (R1), 1.6760 (R2), 1.6820 (R3).
Gold

Gold moved higher, breaking above the 1354 hurdle, but the advance was halted by the next resistance level of 1360 (R1). If the longs manage to achieve a close above the 1354 (S1) barrier, I would expect them to break above 1360 (R1) and target the area of 1370 (R2). Both our momentum studies violated their blue resistance lines, confirming that the precious metal has regained positive momentum. On the daily chart, the price remains supported by the 200-day moving average, increasing the possibilities for further advance.
• Support: 1354 (S1), 1332 (S2), 1310 (S3).
• Resistance: 1360 (R1), 1370 (R2), 1395 (R3)
Oil

WTI fell below the 100.75 obstacle and below the 200-period moving average, completing a failure swing top formation. This confirms a forthcoming lower low and flips the short-term outlook to the downside. I would expect the price to move lower and meet support near the lower boundary of the downward sloping channel and the 98.25 (S1) support. This support coincides with the 50% retracement of the 9th Jan. – 3rd Mar. uptrend and the 161.8% extension of the pattern’s width. As long as WTI is trading within the downward sloping channel and below both the moving averages, I see a negative short-term picture.
• Support: 98.25 (S1), 96.50 (S2), 95.00 (S3)
• Resistance: 100.75 (R1), 103.25 (R2), 105.00 (R3).
BENCHMARK CURRENCY RATES - DAILY GAINERS AND LOSERS

MARKETS SUMMARY

Disclaimer: This information is not considered as investment advice or investment recommendation but instead a marketing communication. This material has not been prepared in accordance with legal requirements designed to promote the independence of investment research, and that it is not subject to any prohibition on dealing ahead of the dissemination of investment research. IronFX may act as principal (i.e. the counterparty) when executing clients’ orders. This material is just the personal opinion of the author(s) and client’s investment objective and risks tolerance have not been considered. IronFX is not responsible for any loss arising from any information herein contained. Past performance does not guarantee or predict any future performance. Redistribution of this material is strictly prohibited.
Risk Warning: Forex and CFDs are leveraged products and involves a high level of risk. It is possible to lose all your capital. These products may not be suitable for everyone and you should ensure that you understand the risks involved. Seek independent advice if necessary. IronFx Financial Services Limited is authorised and regulated by CySEC (Licence no. 125/10). IronFX UK Limited is authorised and regulated by FCA (Registration no. 585561). IronFX (Australia) Pty Ltd is authorized and regulated by ASIC (AFSL no. 417482)