
D.R. Horton, Inc. (NYSE:DHI) exhibited a mixed performance in the fourth quarter of fiscal 2016 with earnings missing the Zacks Consensus Estimate and sales surpassing the same. Shares declined 5.52% in pre-market trading following the release.
However, the TX-based homebuilder’s order trends remained strong in the quarter.
Earnings Miss
The company reported adjusted earnings of 75 cents per share which missed the Zacks Consensus Estimate of 77 cents by 2.6%. However, earnings increased 17.2% year over year driven by higher margins.
Fiscal 2016 earnings came in at $2.36 per share, up from $2.03 a year ago.
Revenues Beat
Total revenue (homebuilding and financial services) of $3.74 billion beat the Zacks Consensus Estimate of $3.67 billion by 0.5%. Total revenue also rose 18.1% year over year.
Fiscal 2016 total revenue was $12.16 billion, up from $10.82 billion in fiscal 2015.
Home Closings and Orders
Homebuilding revenues of $3.65 billion rose 18.1% year over year as the core brands – D.R. Horton, Emerald Homes and Express Homes – performed reasonably well in the quarter.
Home sales increased 19.2% year over year to $3.64 billion aided by higher home deliveries.
Home closings increased 16% to 12,247 homes. The company also registered growth in the East, Midwest, Southeast and South Central, Southwest and West regions.
Net sales orders rose 3% to 8,744 homes on continued improvement in sales. Orders increased across all the operating regions, barring South Central. The value of net orders grew 7% to $2.6 billion. Cancellation rate of 28% was higher than 27% in the last-year quarter.
The quarter-end sales order backlog (under contract) rose 8% to 11,475 homes. Backlog value grew 9% to $3.4 billion.
Land sales contributed $13.5 million to revenues, lower than $39 million a year ago.
Revenues from the financial services segment increased 10.9% to $90.3 million.
Margins Improve
Gross profit on home sales was $746.6 million, up 22.9% year over year. Gross margin on home sales expanded 60 basis points (bps) year over year to 20.5%.
Cost control, lower incentives and higher prices offset higher costs, resulting in gross margin growth.
Homebuilding selling, general and administrative expenses (SG&A) were $321.9 million, up 18% from the prior-year quarter.
SG&A expenses, as a percentage of homebuilding revenues, remained flat year over year at 8.8%.
Homebuilding pre-tax income rose 34.1% year over year to $405 million. Higher homebuilding revenues drove the upside. Pre-tax income from financial services came in at $28 million, down 23.9% year over year.
Consolidated pre-tax income was $433 million in the quarter, up 27.8% year over year. Pre-tax profit margin improved 90 bps to 11.6%.
Balance Sheet
D.R. Horton’s homebuilding cash, cash equivalents and marketable securities totaled $1,271.8 million as of Sep 30, 2016, compared with $1,354.8 million as of Sep 30, 2015.
In fiscal 2016, D.R. Horton generated $618 million of operating cash compared with $700.4 million in the prior fiscal.
Fiscal 2017 Outlook
D.R. Horton continues to maintain a positive outlook with revenues and profits expected to increase in double digits, annually.
Total revenue is projected in the range of $13.4 billion to $13.8 billion. Consolidated pre-tax margin guidance is estimated in the band of 11.2% to 11.5%. Homebuilding SG&A expenses, as a percentage of homebuilding revenues, will likely be approximately 9.0%.
Home closing is likely to be between 43,500 homes and 45,500 homes.
Tax rate is likely to be at around 35%. Cash flow from operations is expected between $300 million and $500 million.
D.R. Horton carries a Zacks Rank #2 (Buy). You can see the complete list of today’s Zacks #1 Rank (Strong Buy) stocks here..
Peer Releases
Martin Marietta Materials, Inc.'s (NYSE:MLM) third-quarter 2016 adjusted earnings per share of $2.49 missed the Zacks Consensus Estimate of $2.64 by about 5.7%. However, earnings rose 43% from the prior-year quarter.
Masco Corporation (NYSE:MAS) released third-quarter results wherein both earnings and revenues missed the Zacks Consensus Estimate.
PulteGroup Inc.’s (NYSE:PHM) third-quarter 2016 earnings were in line with the Zacks Consensus Estimate while revenues missed the mark.
D R HORTON INC Price, Consensus and EPS Surprise
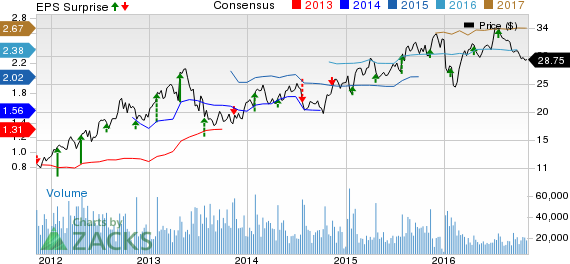
D R HORTON INC Price, Consensus and EPS Surprise | D R HORTON INC Quote
Confidential from Zacks
Beyond this Analyst Blog, would you like to see Zacks' best recommendations that are not available to the public? Our Executive VP, Steve Reitmeister, knows when key trades are about to be triggered and which of our experts has the hottest hand. Click to see them now>>
MASCO (MAS): Free Stock Analysis Report
MARTIN MRT-MATL (MLM): Free Stock Analysis Report
PULTE GROUP ONC (PHM): Free Stock Analysis Report
D R HORTON INC (DHI): Free Stock Analysis Report
Original post
Zacks Investment Research