Get 40% Off
👀 👁 🧿 All eyes on Biogen, up +4,56% after posting earnings. Our AI picked it in March 2024.
Which stocks will surge next?
Unlock AI-picked Stocks

Cyclicals Vs. Defensives PB Ratio At A Cyclical High?

Published 09/26/2017, 06:00 AM
Updated 07/09/2023, 06:31 AM

I was running some analysis on cyclical vs defensive sectors and decided to take a look at the price to book ratios. While we can argue about whether the P/B (price to book) ratio is the right metric, what's clear is these indicators are at extreme levels.

The chart comes from the latest edition of the Weekly Macro Themes report in a running topic that covered a growing list of bearish indicators.

The chart in question is shown below. It shows the average P/B ratio for cyclical sectors, defensive sectors, and the ratio of cyclicals vs defensives (i.e. relative value). The details follow...
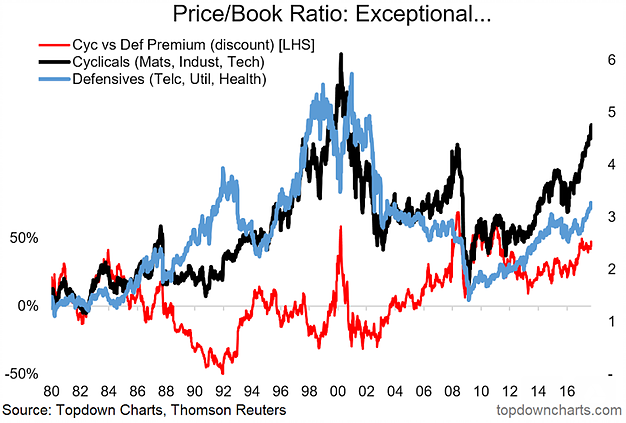
Price-Book Ratio Exceptional

First a technical note, the cyclical sectors are: Basic materials, Industrials, and Technology - the defensive sectors are: Telecoms, Utilities, and Health care. The data is from the Thomson Reuters Datastream total market indexes. The readings in the chart are a non-weighted average across the sectors.

The main finding is that cyclicals look extremely expensive vs history. They also look very expensive vs defensive. Defensives also look increasingly expensive. The individual sectors also look expensive vs their own history e.g. basic materials and industrials are trading on P/B ratios 2SD above their long term average, and 1 SD for technology. While health care and telecoms are trading in line with their long term average, utilities are trading almost 2SD above their long term average - surely a result of the chase for yield.

Expensive valuations are not enough in and of themselves to be tactically bearish - you need other factors to line up such as technicals/sentiment or a rolling over of the economics, or some other catalyst. They do however mean the stakes are higher, and the downside risk should one of these triggers come is steadily higher.

3rd party Ad. Not an offer or recommendation by Investing.com. See disclosure here or remove ads .

The reason this chart was included in my piece of analysis on bearish signals for US equities is that in this phase of the bull market any signs of vulnerabilities in cyclicals needs to be paid attention to as they have been a key source of strength. So it stands to reason that should cyclicals come unstuck they will most likely take the whole market down with them.

Latest comments

Risk Disclosure: Trading in financial instruments and/or cryptocurrencies involves high risks including the risk of losing some, or all, of your investment amount, and may not be suitable for all investors. Prices of cryptocurrencies are extremely volatile and may be affected by external factors such as financial, regulatory or political events. Trading on margin increases the financial risks.
Before deciding to trade in financial instrument or cryptocurrencies you should be fully informed of the risks and costs associated with trading the financial markets, carefully consider your investment objectives, level of experience, and risk appetite, and seek professional advice where needed.
Fusion Media would like to remind you that the data contained in this website is not necessarily real-time nor accurate. The data and prices on the website are not necessarily provided by any market or exchange, but may be provided by market makers, and so prices may not be accurate and may differ from the actual price at any given market, meaning prices are indicative and not appropriate for trading purposes. Fusion Media and any provider of the data contained in this website will not accept liability for any loss or damage as a result of your trading, or your reliance on the information contained within this website.
It is prohibited to use, store, reproduce, display, modify, transmit or distribute the data contained in this website without the explicit prior written permission of Fusion Media and/or the data provider. All intellectual property rights are reserved by the providers and/or the exchange providing the data contained in this website.
Fusion Media may be compensated by the advertisers that appear on the website, based on your interaction with the advertisements or advertisers.
© 2007-2024 - Fusion Media Limited. All Rights Reserved.