
CyberArk Software Ltd. (NASDAQ:CYBR) reported mixed second-quarter 2017 results, wherein the bottom line surpassed the Zacks Consensus Estimate, however the top line missed the same. However, on a year-over-year basis, the company’s revenues marked a significant improvement, but earnings declined.
The company’s non-GAAP earnings per share of 21 cents came well above management’s guidance range of 23–25 cents, but declined 27.6% on a year-over-year basis. On an adjusted basis too, earnings per share (excluding amortization of intangible assets and other one-time items but including stock-based compensation) on a proportionate tax basis came in at 11 cents per share, which was higher than the Zacks Consensus Estimate. However, it registered a plunge of 47.6% from the year-ago quarter’s earnings of 21 cents.
The year-over-year plunged in earnings on both fronts, i.e. non-GAAP and adjusted, was mainly due to the lower-than-expected sales growth and elevated operating expenses.
CyberArk Software Ltd. Price, Consensus and EPS Surprise
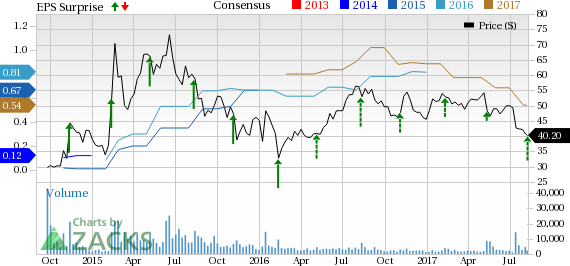
CyberArk Software Ltd. Price, Consensus and EPS Surprise | CyberArk Software Ltd. Quote
Quarter in Detail
CyberArk’s revenues increased just 14.1% year over year to $57.5 million, slowest since it got listed in 2014. The company’s revenues also fell short of management’s guided range of $61–$62 million (mid-point $61.5 million), as well as the Zacks Consensus Estimate of $58 million, mainly due to weak performance in the Europe, Middle East and Africa (EMEA) region resulting from some sales execution problem.
Segment wise, License revenues which accounted for 53% of total revenue, increased 1.2% year over year to $30.3 million. Also, a 34% increase in Maintenance and Professional Services revenues, contributing 47% to total revenues, grew 33% year over year to $27.2 million.
Geographically, on a year-over-year basis, revenues from the Americas increased 21% and contributed 68% of total revenue. Revenues in the Asia Pacific and Japan surged a whopping 39% year over year, representing 8% of total revenue. However, EMEA witnessed a 5% decline and accounted for 24% of total revenue.
CyberArk’s non-GAAP gross margin declined to 85.2% in the second quarter from 87.6% in the year-ago quarter. The decline was primarily due to slight change in the revenue mix, and investments cloud infrastructure and professional services.
The company’s non-GAAP operating margin declined to 15.3% from 26.9%, primarily due to lower gross margin and elevated operating expenses as a percentage of revenues. Escalated operating expenses were mainly stemmed by increased investment toward enhancing product offerings and expanding sales capabilities.
CyberArk exited the quarter with cash, cash equivalents, short-term deposits and marketable securities of approximately $239 million, down from $267.7 million at the end of first-quarter 2017. Receivables were $30.3 million at the end of the reported quarter.
CyberArk’s balance sheet does not have any long-term debt. The company reported cash flow from operations of approximately $29.7 million in the first half of 2017.
Guidance
The company provided guidance for the third quarter and updated the full-year 2017 outlook.
For the third quarter, CyberArk expects revenues in the range of $62–$63 million (mid-point $62.5 million), representing 13–15% year-over-year growth. The mid-point of the guided range, however, is below the Zacks Consensus Estimate of $63.26 million. Non-GAAP operating income is estimated to be in the range of $8.2–$9 million. The company projects non-GAAP earnings for the second quarter in the 17–19 cents range.
For the year, the company lowered its outlook. CyberArk now anticipates revenues in the band of $253–$256 million (mid-point $254.5 million), representing 17–18% year-over-year growth, down from the previous range of $268.5–$271.5 million (mid-point $270 million). The guided range at the mid-point is lower than the Zacks Consensus Estimate of $254.72 million.
The non-GAAP operating income projection has been lowered to $46.4–$48.4 million from the previous guidance range of $55–$57 million. Similarly, non-GAAP earnings for 2017 are now expected to be between $1.02 and $1.06 per share, down from the earlier guided range of $1.18–$1.22.
Conjur Acquisition
Concurrent with the second-quarter results, CyberArk announced that the integration of recently acquired privately-held – Conjur Inc. – is on track. Conjur is specialized in offering DevOps security software. Therefore, the acquisition is anticipated to boost CyberArk’s capabilities in empowering companies to accelerate software deployment in their organizations with more security. Per the company, till now it has received strong customer response for Conjur.
Our Take
CyberArk is an Israeli company that specializes in protecting accounts from cyber attacks. The company offers several products that protect passwords, close loopholes in the security system, and secure cloud-based assets.
Furthermore, it should be noted that, in the last three quarters the company has reported the slowest revenue growth rate since it was enlisted in Sep 2014. Prior to the second quarter, it was around 25%, but in the last quarter it came even worse at 14%. Prior to the last three quarters, CyberArk had witnessed over 35% revenue growth every quarter.
Moreover, its outlook for the third quarter as well as full year indicates that it will remain around 15%. This makes us slightly cautious about its future prospects. Intensifying competition from peers such as CA Inc. (NASDAQ:CA) and Microsoft Corp. (NASDAQ:MSFT) , and an uncertain macroeconomic environment add to its woes.
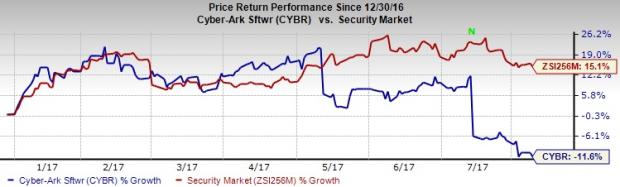
Notably, CyberArk has underperformed the industry to which it belongs to in the year-to-date period. The stock has lost 11.6% of its value year to date versus 15.1% growth of its industry.
Currently, CyberArk carries a Zacks Rank #4 (Sell).
A better-ranked stock in the same industry space is Imperva Inc. (NASDAQ:IMPV) , which sports a Zacks Rank #1 (Strong Buy). You can see the complete list of today’s Zacks #1 Rank stocks here.
The stock has long-term expected EPS growth rate of 25%.
More Stock News: Tech Opportunity Worth $386 Billion in 2017
From driverless cars to artificial intelligence, we've seen an unsurpassed growth of high-tech products in recent months. Yesterday's science-fiction is becoming today's reality. Despite all the innovation, there is a single component no tech company can survive without. Demand for this critical device will reach $387 billion this year alone, and it's likely to grow even faster in the future.
Zacks has released a brand-new Special Report to help you take advantage of this exciting investment opportunity. Most importantly, it reveals 4 stocks with massive profit potential. See these stocks now>>
CyberArk Software Ltd. (CYBR): Free Stock Analysis Report
Microsoft Corporation (MSFT): Free Stock Analysis Report
CA Inc. (CA): Get Free Report
Imperva, Inc. (IMPV): Free Stock Analysis Report
Original post
Zacks Investment Research