While the general economy continues to expand at its now famous “moderate” pace, several economic releases over the last few months indicate there are small areas of softness. Two consecutive months of weaker auto sales will likely translate into slightly lower auto sector employment in the summer or early fall. While the recently declining average monthly establishment job gains are probably a sign of full employment, they could also indicate the economy is far closer to a recession than before.
These two data points indicate it’s appropriate to look at the macro-level economy to determine the probability of a recession. This column will look at the long-leading, leading and coincident indicators as well as the possibility for a macro-level commodity or financial shock. The next column will look at the itemized components of GDP to see if any undetected weakness currently exists.
Let’s begin with a look at the long-leading indications:
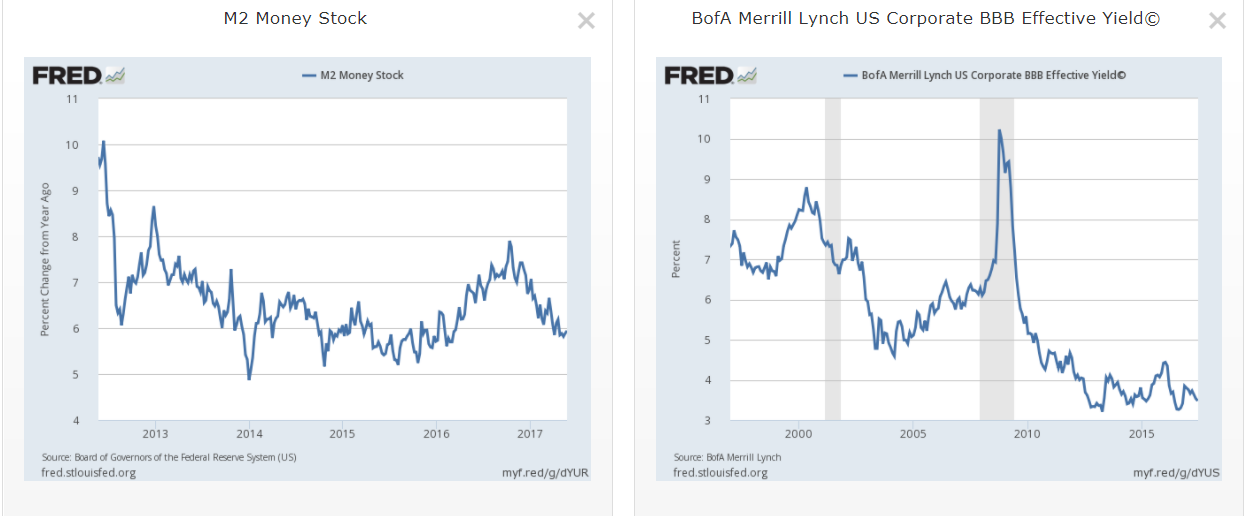
Money growth (left chart) is still positive and the more speculative yield spreads (right chart; here the BBB) are contained.
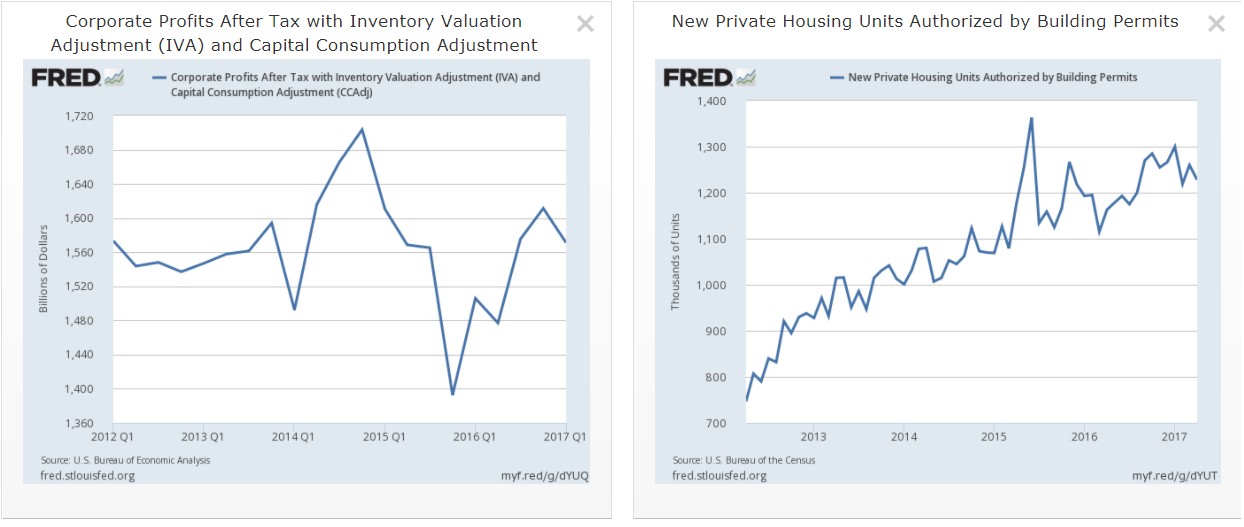
The BEA’s corporate profits number (left chart) decreased in the latest GDP reading. However, the 1Q news from Zacks and Factset was positive. The obvious difference between these two numbers is that the former includes non-publicly traded companies and is therefore broader. But the latter isolates and reports on the largest and therefore most economically important companies. But even the BEAs numbers increased in 3 of the last 5 quarters and shows no sign of contraction. Building permits (right chart) have trended between 1.1 and 1.3 million over the last 2 years. It’s possible to argue this might be a sign of the market topping out. It could also show that home builders are more conservatively managing inventory. Neither interpretation points to a contraction on the near or intermediate horizon.
The leading and coincident indicators also point to moderate growth:
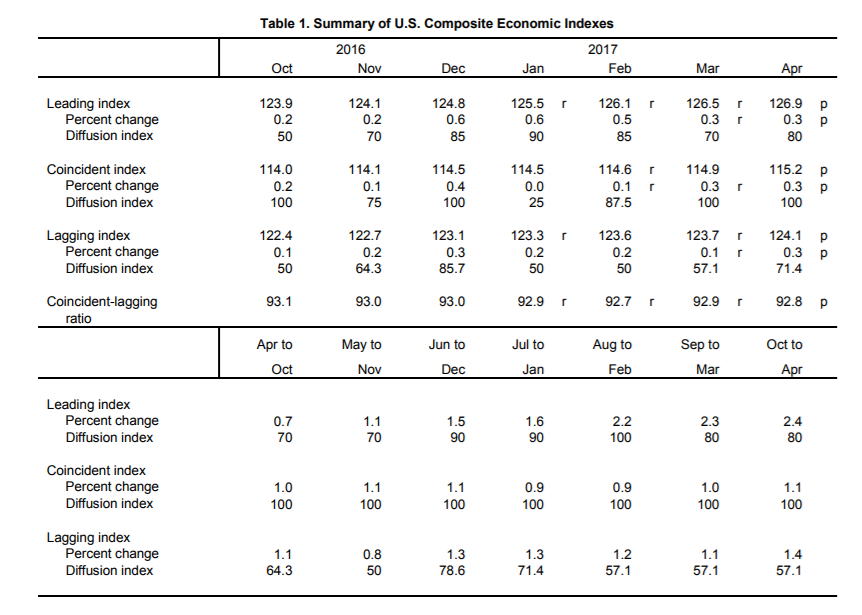
The top table shows LEIs and CEIs M/M gain: since October, the former increased between .2 and .7 while the latter usually increased at a slightly slower rate. The bottom table shows the rolling 6-month increase. The LEIs rate of change has increased from .7 in October to 2.4% in April. The CEIs rate of change has averaged about 1%. As with the long leading indicators, the LEIs and CEIs indicate the economy should continue growing at a moderate pace in the next 6-12 months.
Finally, what are the probabilities for either an oil price shock or some type of asset bubble bursting? James Hamilton identified the former as having a primary correlation with an economic slowdown when he noted in his famous 1983 paper:
All but one of the U.S. recessions since World War II have been preceded, typically with a lag of around three-fourths of a year, by a dramatic increase in the price of crude petroleum. This does not mean that oil shocks caused these recessions. Evidence is presented, however, that even over the period 1948-72 this correlation is statistically significant and nonspurlious, supporting the proposition that oil shocks were a contributing factor in at least some of the U.S. recessions prior to 1972. By extension, energy price increases may account for much of post-OPEC macroeconomic performance.
The latter caused not only the Great Depression but the great recession and, to a lesser extent, the early 2000s recession.
Oil prices are contained. West Texas intermediate crude has traded between the upper 30s and the mid-50s since 2Q16. This market is currently experiencing a supply glut, implying there is little chance of a recession-causing price spike. While there is always the possibility of a Middle East conflict spiking prices, none appears on the horizon.
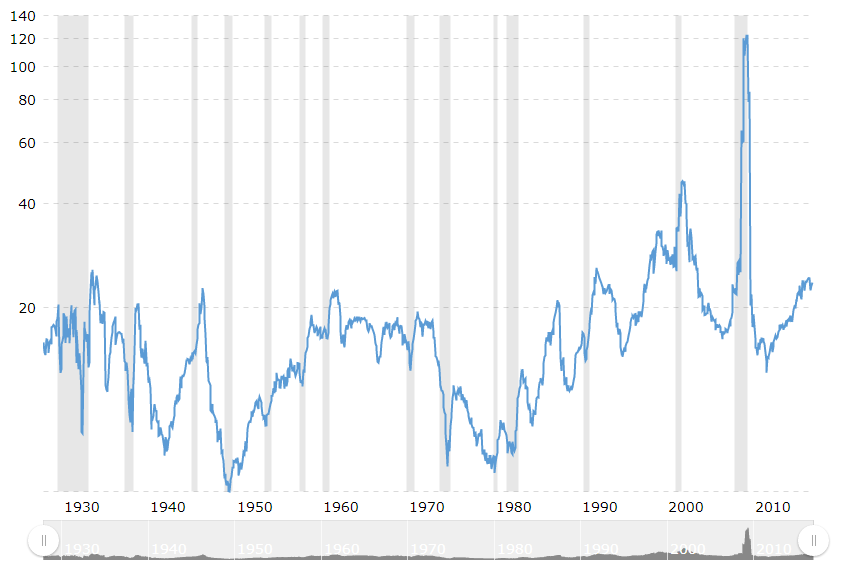
And there is no reason to believe a financial shock is possible, as neither the equity nor housing market are in a speculative bubble. While the stock market is expensive, it’s nowhere near the lofty PE valuations of the late 1990s:
And the housing market is now vastly different than the heady days of the housing market bubble. There are no stories of flipping or horrendously documented loans. The new homes market is characterized by builders who learned the lessons of overbuilding. Finally, the Case Shiller indexes show a market that has consistent but contained price increases:
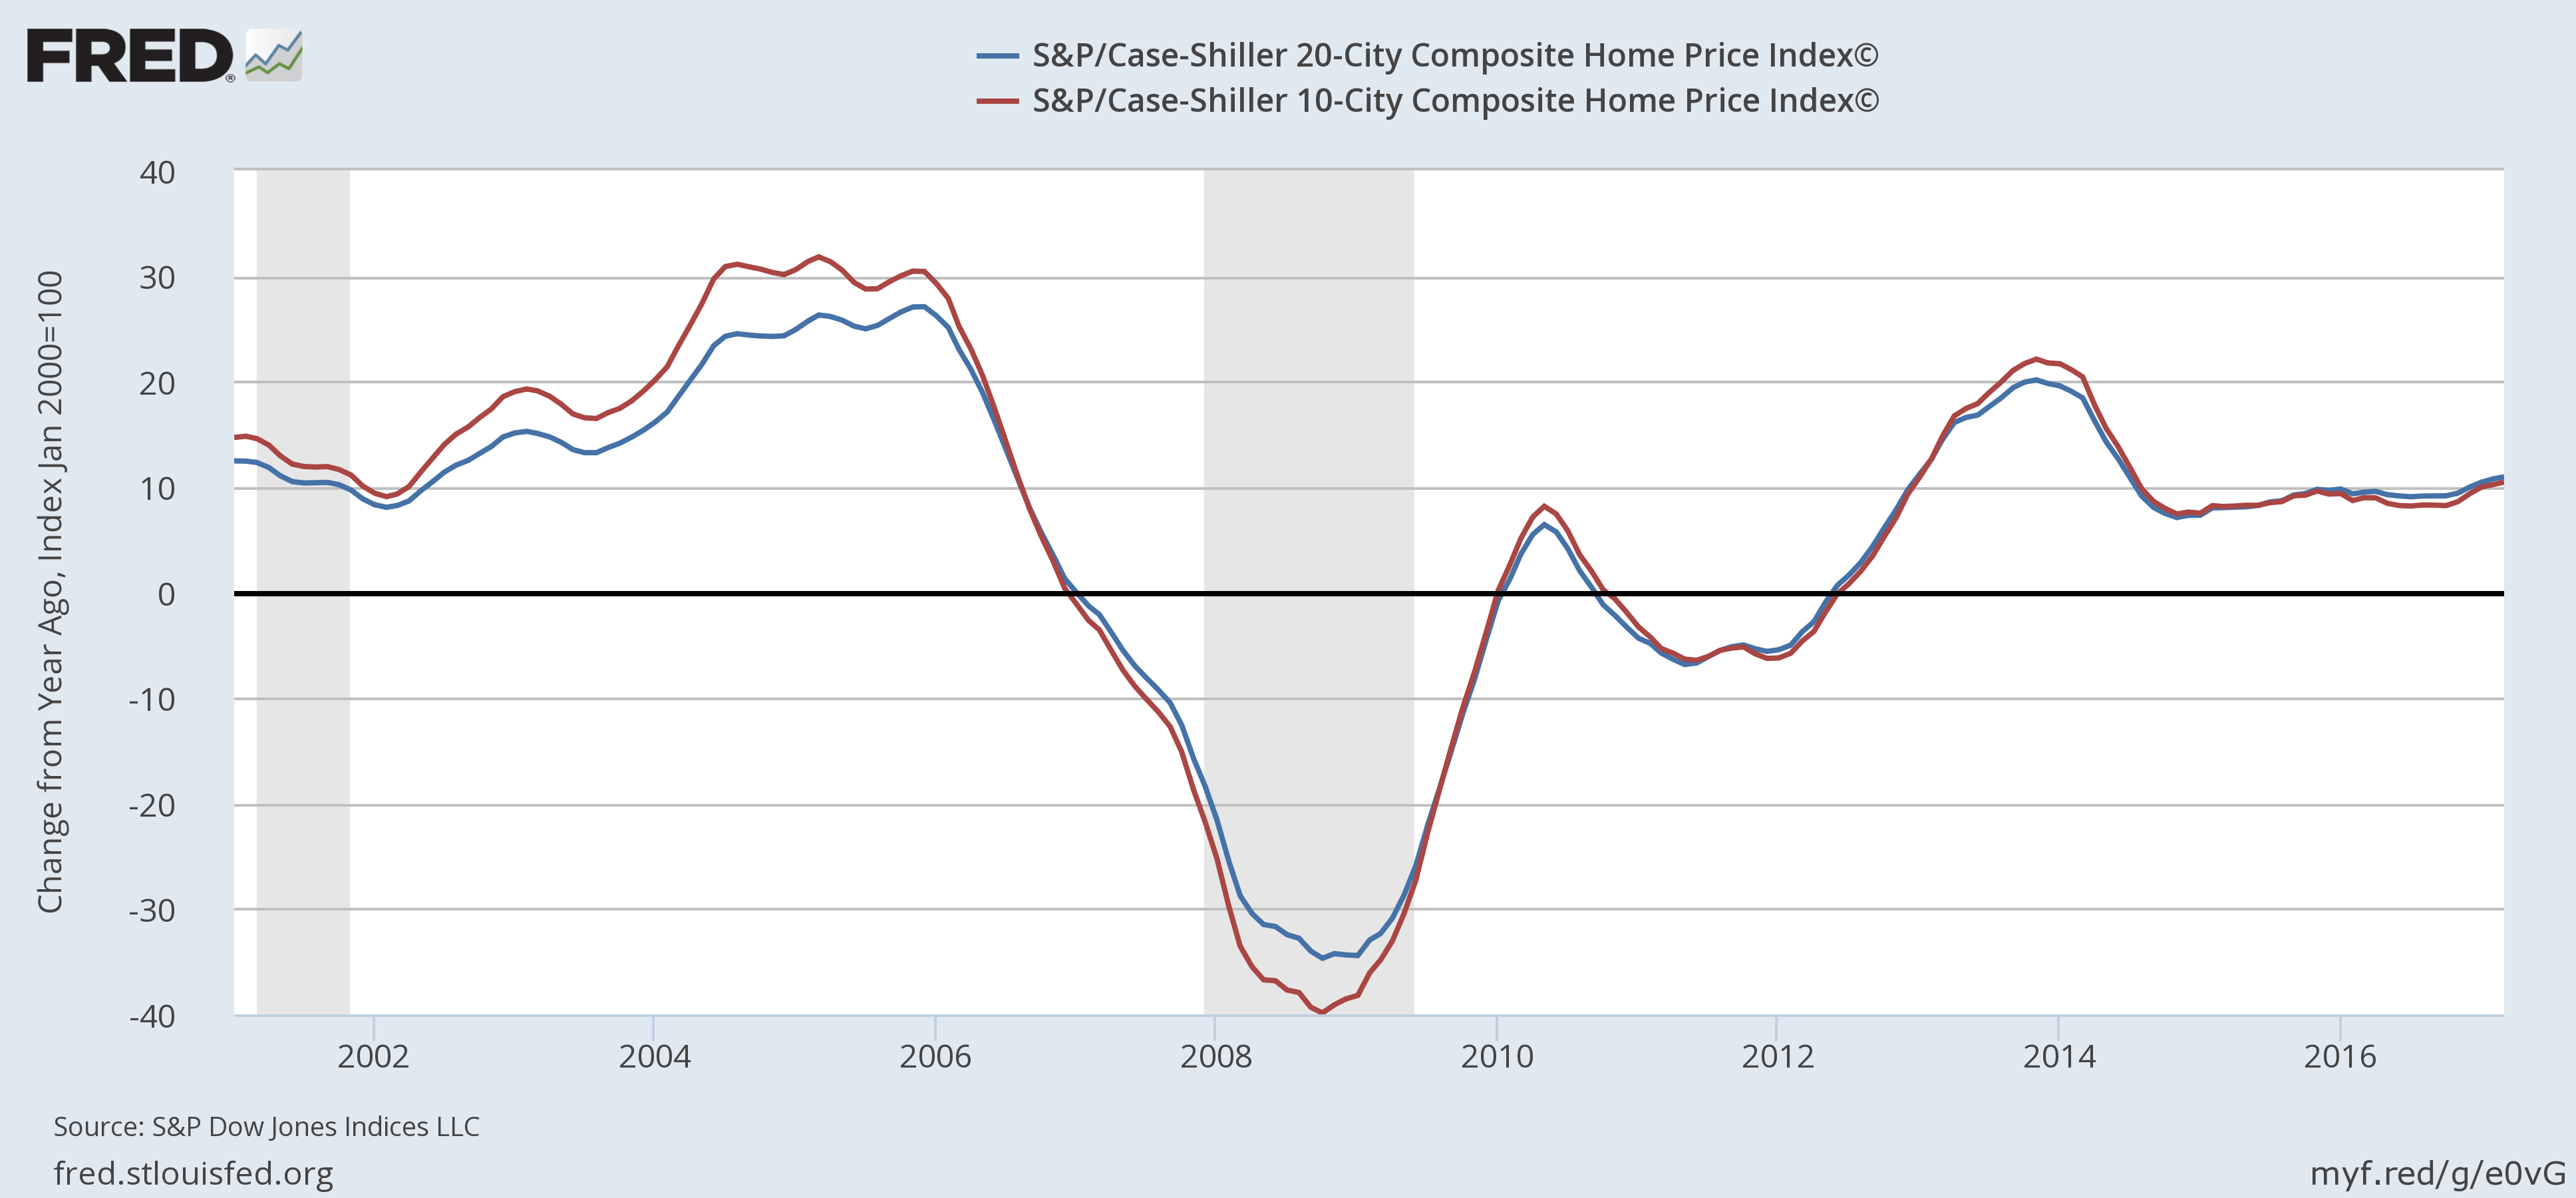
In short, there is no reason to believe an asset price bubble is on the horizon.
To conclude, the long-leading, leading and coincident indicators all argue for a continued moderate expansion.
