
CSX Corporation (NASDAQ:CSX) reported third-quarter 2016 earnings of 48 cents per share, which beat the Zacks Consensus Estimate of 45 cents.
Revenues of $2.71 billion outpaced the Zacks Consensus Estimate of $2.68 billion but declined 7.8% year over year due to a 8% overall decrease in volumes. The company’s lower volumes can be attributed to more than 21% coal volume decline. Third-quarter operating income also fell 10% year over year to $841 million. Moreover, operating ratio (defined as operating expenses as a percentage of revenues) contracted 70 basis points to 69%. Operating expenses decreased 7% year over year to $1.87 billion.
Segmental Performance
Merchandise revenues dipped 4% year over year to $1,741 million in the quarter owing to 5% decrease in volume. This was largely a result of a revenue decline of 7% and 8% in Chemicals and Agricultural and Food Products segments, respectively.
Coal revenues plunged 20% year over year to $467 million due to a 21% reduction in volumes owing to soft global coal demand and declining fuel prices.
Intermodal revenues dropped 6% year over year to $425 million. On a year-over-year basis, volumes declined 7%.
Other revenues grossed $77 million, down 10% year over year.
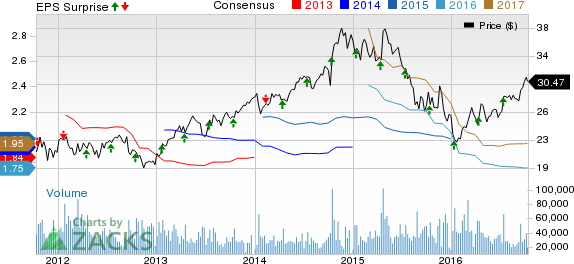
CSX CORP Price, Consensus and EPS Surprise
Liquidity
CSX Corp, which carries a Zacks Rank #3 (Hold), exited the third quarter with cash and cash equivalents of $603 million compared with $628 million at the end of 2015. You can see the complete list of today’s Zacks #1 Rank stocks here. Long-term debt totaled $9,888 million as against $10,515 million at the end of 2015. For the period ending Sep23, 2016, net cash from operating activities was $2,488 million compared with $2,512 million in the year-agoperiod.
Notably, the company declared dividends of 18 cents per share, which is payable on Dec 15, 2016, to shareholders on record as of Nov 30, 2016.
Guidance
CSX Corp. mentioned that despite the sustained dollar strength and low commodity prices, it is making all efforts to maximize shareholder value. It expects to achieve operating ratio in mid-60s range in the long term.
Most U.S.-based railroads like Norfolk City Southern (NYSE:NSC) , Kansas City Southern (NYSE:KSU) and Union Pacific Corp. (NYSE:UNP) have been facing difficulties in boosting their top line as weak energy markets continue to prevail in the nation as well as globally.
Confidential from Zacks
Beyond this Analyst Blog, would you like to see Zacks' best recommendations that are not available to the public? Our Executive VP, Steve Reitmeister, knows when key trades are about to be triggered and which of our experts has the hottest hand. Click to see them now>>
KANSAS CITY SOU (KSU): Free Stock Analysis Report
CSX CORP (CSX): Free Stock Analysis Report
UNION PAC CORP (UNP): Free Stock Analysis Report
NORFOLK SOUTHRN (NSC): Free Stock Analysis Report
Original post
Zacks Investment Research