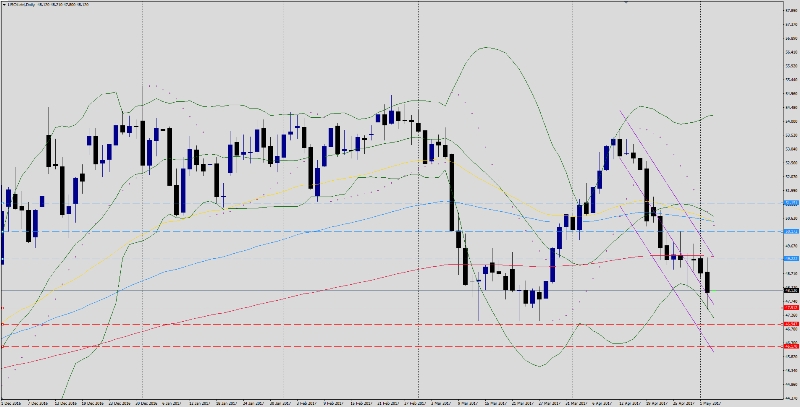
Crude oil Slips Over Signs of Increasing U.S Oil Inventories And Weaker OPEC Compliance
Crude oil prices plunged to $47.47 low on Tuesday, adding additional losses for this week with -$1.80, almost 3%, and on Wednesday, crude scored $47,80 low, currently trading 48.18 intraday. Crude bearish forces were the result of two factors.
1- U.S. production increased by more than 450,000 barrels per day (bpd) in the past five months ending in Feb, according to the U.S. Energy Information Administration (EIA). Total U.S. crude production has increased from a recent low of 8.567M bpd in Sep to 9.031M bpd in February (“Petroleum Supply Monthly”, EIA, April 28).
Production continued rising in March and Apr, and now stands at over 9.2M bpd, according to weekly estimates published by the agency (“Weekly Petroleum Status Report”, EIA, April 26).
The rapid recovery in U.S. output is one of the factors making market re-balancing slower than OPEC anticipated. Most of the increase so far has come from non-shale producers in the Gulf of Mexico and Alaska. But the massive increase in the number of rigs drilling onshore should ensure shale output rises substantially in the remainder of 2017. Gulf of Mexico output rose by 228,000 bpd in the five months to February, while onshore production from the lower 48 states increased by 175,000 bpd and Alaska’s output rose 61,000 bpd. (Reuters).
2- OPEC oil output fell for a fourth straight month in April, a Reuters survey found on Tuesday, as top exporter Saudi Arabia kept production below its target while maintenance and unrest cut production in exempt nations Nigeria and Libya. But more oil from Angola and higher UAE output than originally thought helped OPEC compliance with its production-cutting deal slip to 90 percent from a revised 92 percent in March, according to Reuters surveys.
Eyes are focused now on May 25th where OPEC will meet again in Vienna where they will decide on extension for end of 2017. OPEC had already met on the end of 2016 where they agreed to cut oil production till June 2017 with efforts to curb global oil supply, which resulted in in highest levels for crude oil at $55.22 bp on Jan 2017.
There seems to a be a general consensus to do so, Khalid Al-Falih, the Saudi minister of energy and industry and the de-facto OPEC leader, said last week. The United Arab Emirates insisted Tuesday that all participants -- which include some non-OPEC nations such as Russia -- need to commit to the effort. If OPEC meeting on 25th May was successful, market should expect a new crude record for 2016 aimed at $60 bp.
Today U.S. inventories will be published at 2:30 PM GMT which should bring new perspectives for crude levels.
Technical Overview:
Trend: Down / Sideways
Resistance levels: R1 49.22, R2 50.17, R3 51.15
Support levels: S1 47.51, S2 46.94, S3 46.17
Comment: The market remains bearish but U.S. crude inventories today should bring new perspectives for oil levels. A penetration for R1 level projects further bullish hikes with targets R2&R3 level. Closing below S1 will increase further selloffs and wash towards S2 level. A close above R2 level alerts for trend reversal and only closing above R3 confirms that market has shifted upward and crude to be considered bullish.

