Crude Oil Under Pressure From Rising US Production
Crude Oil is about to break its 13 month uptrend as rising US crude production is starting to break down the price of Crude Oil. This is despite OPEC announcing a supply cut some months ago to help stabilize the price of Crude Oil.
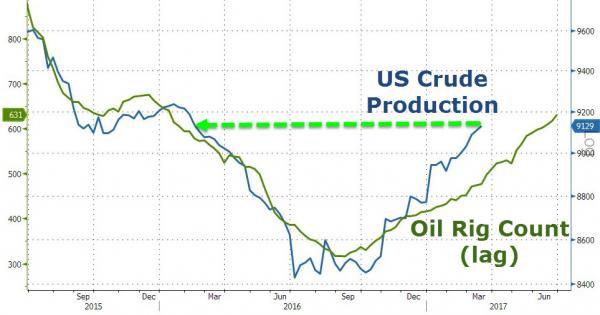
If you take a look at the chart below of US Crude production and Oil Rig count within the US, they both seemed to level out around September / October 2016 just as the last leg of the downtrend of Crude Oil was playing out. Since making the lows late last year the rig count has been steadily rising with production levels rising along side the rig count albeit on a 1 - 2 month lag.

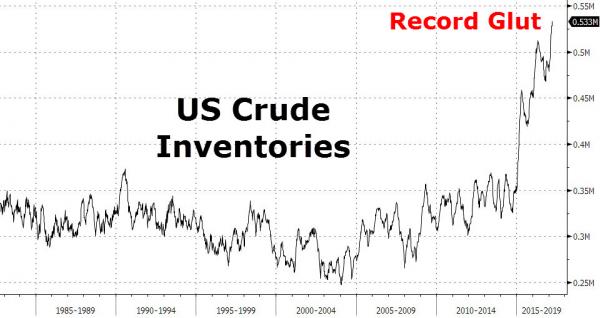
Record US Crude Production Leads To Record Glut
Since US crude oil production has been soaring for several months now, inventories have also been rising along with rising production. Compounding the issue is the US economy which has been slowing for close to two years now. Now the decline in the US economy is accelerating consumption demand for gasoline within the US is also falling. Hence you will notice on the chart below on the right the sudden spike higher in inventories.

Crude Oil Monthly Chart Review
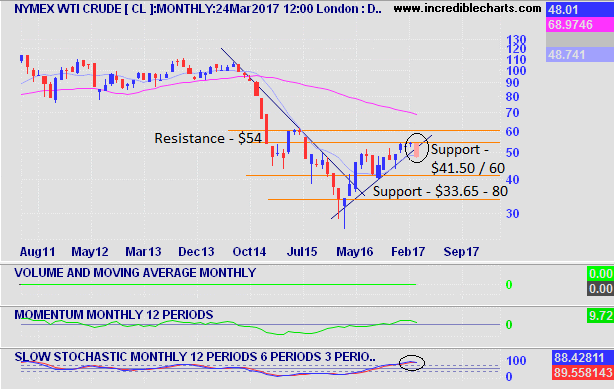
Since making multi year lows back in February 2016 touching USD $26.14 a barrel, Crude Oil had been steadily climbing for around 13 months. After closing above its downtrend line back in April 2016, Crude continued to march higher for the remainder of 2016 and into early 2017. With just 1 trading week left in the month of March, unless there is a major reversal this week Crude Oil is set to close below its 13 month uptrend with a large red candle.
Crude Oil Heading Towards $41.50 Target
Based on the current outlook of the Monthly chart with a clear break of the uptrend currently occurring for Crude Oil, the next level of support on a monthly chart is around the $41.50 - 60 level which is another $6.50 - $6.60 or 13.75% lower from the current price.
Looking at the momentum indicators below, they are both supporting the current weakness in the price, as Momentum even though is still positive is heading back towards zero. The stochastic momentum indicator is also showing that based on the current price of $48 would form a bearish cross. (See circled area within Stochastic indicator) Monthly stochastic indicators are usually more reliable indicator of change of trends as they are much longer time frame and take a long time to form.

Hedge Funds Change Direction As Crude Oil Prices Shifts
Up until as recently as February 2016 Hedge Funds had placed a record amount of long contracts (betting on higher prices) for Crude Oil. Since then Hedge funds have begun to reverse their bullish bets setting a new record for reducing the bets for higher prices. The swift change in sentiment among Hedge Funds and Traders was due to the price falling below the physiological $50 level.
Crude Oil - Weekly Chart Review
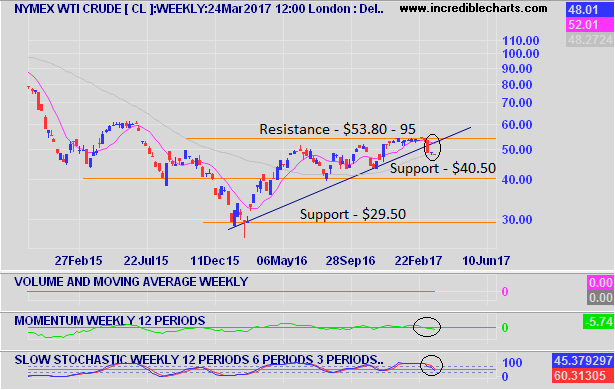
Taking a closer look at Crude Oil via the weekly chart you can see that the price tried to break higher numerous times back in January and February this year. However after reaching the the $53.80 - $53.95 level on several occasions the price collapsed a few weeks with a long red candle which I have circled on the chart.
Momentum Falls Below Zero
Momentum is currently sitting at -5.74 on the weekly chart having closed below zero in the first week of March as the bulls became exhausted and finally gave in to lower prices.
The weekly Stochastic momentum indicator has been falling for several weeks now confirming the weakness in price. Since both indicators are supporting the falls in price on the weekly and monthly chart, it suggests that there is a high probability that the weakness in Crude Oil will continue over the medium to long term.
Since Crude Oil has confirmed a close below the weekly uptrend 3 weeks ago, the next level of support on the weekly chart is $40.50 a barrel.
Watch For A Surprise Reversal Above $54
Although very unlikely to occur over the coming weeks, I suggest watching out for a potential reversal in price back to the current resistance level of just below $54 a barrel. There may be another attempt to break above $54 but will unlikely succeed with current oversupply issues facing the market with rising US production. The reason why I suggest looking at for the reversal is if OPEC announces further cuts to their supply to attempt to stop the falls in price.

Disclaimer: This post is for educational purposes only, and all the information contained within this post is not to be considered as advice or a recommendation of any kind. If you require advice or assistance please seek a licensed professional who can provide these services.
