
On October 3rd, the price of WTI crude oil was up 27.9% year-to-date, corresponding to a rally from $60.09 to $76.88 a barrel in a little over nine months. Unfortunately for the bulls, no trend lasts forever and the rest of October confirmed that fact. Crude oil prices plunged to $64.83 yesterday, erasing almost 72% of all 2018 gains in less than 30 days.
Now, we do not pretend to have known that this was going to happen all along. Still, here is how the Elliott Wave Principle helped us take advantage of a good part of the selloff. The following chart was sent to our subscribers as a short-term update on Wednesday, October 17th.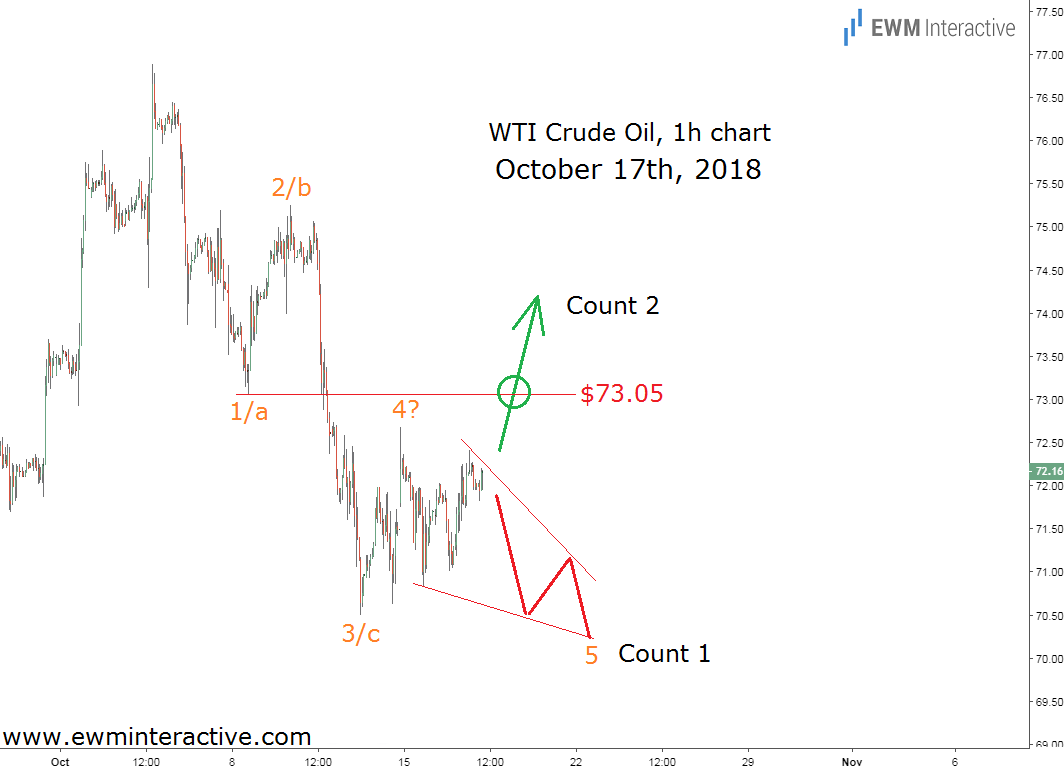
On October 17th, WTI was still holding above $72 a barrel. The problem was that the structure of the decline from $76.88 to $70.49 was limited to just three waves. This left us with two equally probable possibilities.
One, that this decline represented the first three waves, 1-2-3, of a larger five-wave impulse, whose wave 5 was then in progress. And two, that it was just a three-wave correction, labeled a-b-c, within the larger uptrend.
Crude Oil – Dealing with Uncertainty
There was no way to tell which of the two alternatives the market was going to choose. We simply had to keep both of them in mind. The good news is that the Elliott Wave principle allowed us to identify $73.05 as a key level. It was going to make the difference between the two counts. Within an impulse, waves 1 and 4 cannot overlap.
Hence, as long as WTI crude oil was trading below this level, the bears remained in charge and more weakness could be expected. On the other hand, if the price was to exceed $73.05, the positive outlook would be confirmed and the negative one – invalidated. In the end, it all came down to this: below $73.05 – count 1, above $73.05 – count 2. By October 22nd, when we sent the next updates to clients, $73.05 was still intact.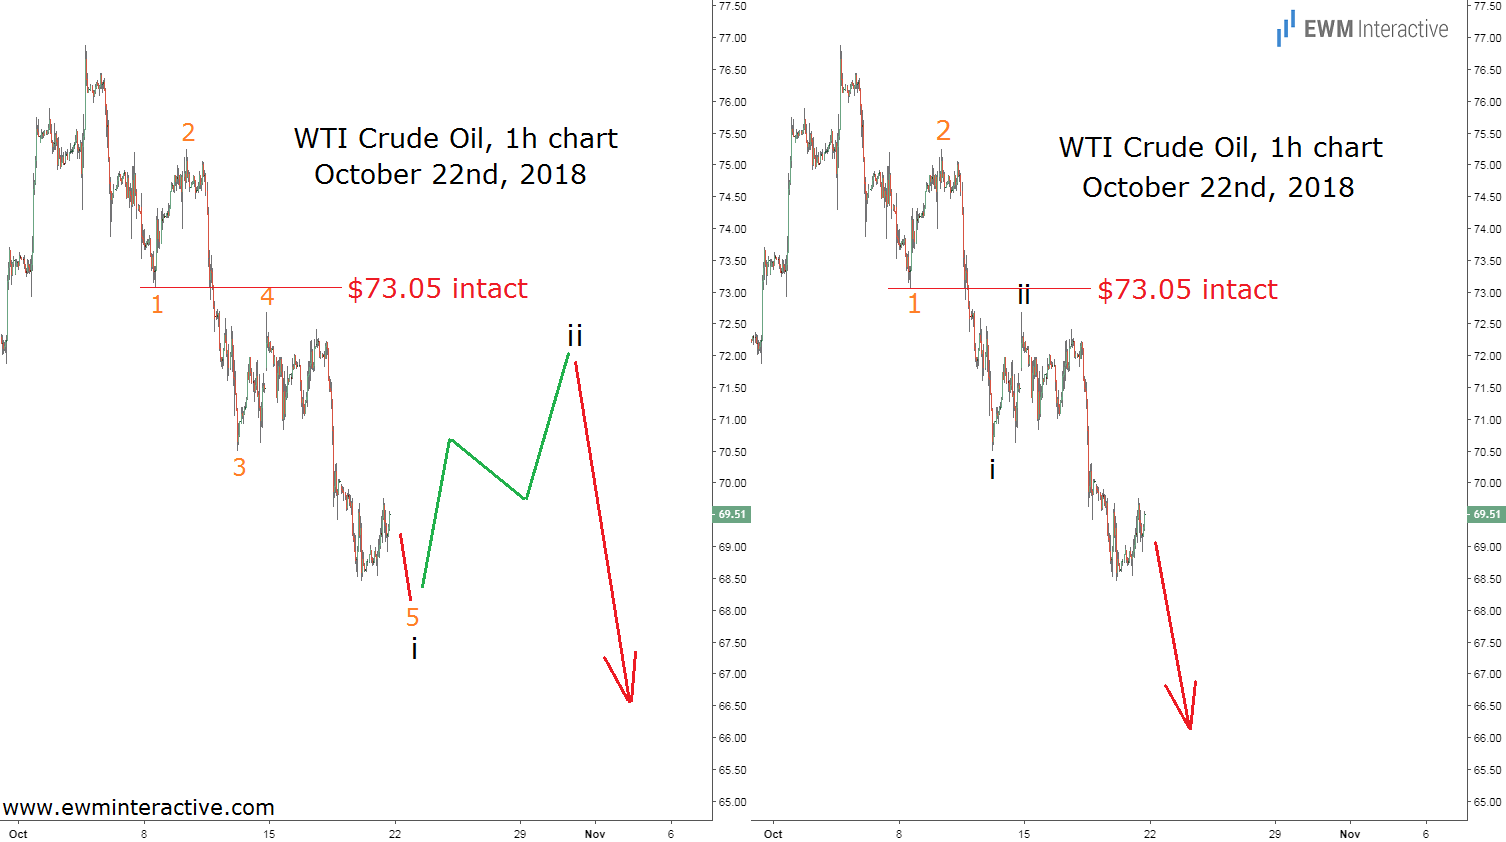
Crude oil was down to $69.51, but we were once again facing two equally probable alternatives. Fortunately, this time they both pointed in the same direction. The only difference was that one of them allowed for a three-wave recovery in wave ii before the bears return.
“As Simple as Possible, but Not Simpler”
However, the other one suggested the price might head straight down in wave iii, so even if a recovery really was to occur, we were going to simply wait it out and stick with the bears. Gladly, the market decided not to overcomplicate the situation.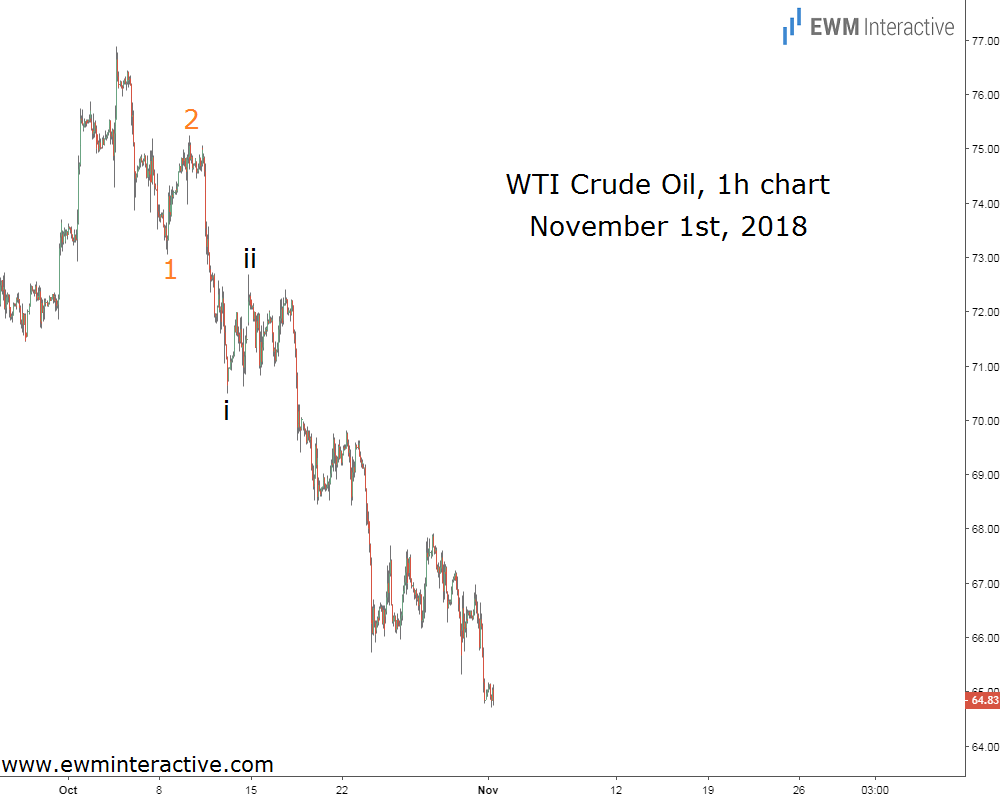
As of this writing, WTI crude oil trades near $64.80 and we can now say it all went very well for the bears. Just remember that this outcome was never certain. No matter how much effort you put into the analysis, the last word always belongs to the market. That is why it is a good idea to keep an alternative count in mind, just in case the primary one fails.
Fortunately, the rules and guidelines of the Elliott Wave theory will often help you identify the exact price level which separates the two. That way you can make trading decisions based on probabilities, without worrying that you do not know what is going to happen. Because, honestly, you can never actually “know” what will happen in the market. Do not let that stop you from taking advantage of it.