- Higher lows and higher highs since April, the consolidation
- Open interest sends a message, inventories rose again last week
- Crude oil is at an inflection point
On April 20, the expiring May NYMEX Crude Oil Futures contract fell to a price that most market participants never imagined when they reached over $40 per barrel below zero. Since the NYMEX futures call for delivery of West Texas Intermediate crude oil in Cushing, Oklahoma, the lack of storage capacity sent the landlocked energy commodity into negative territory as it became a bearish hot potato. Holders of the expiring contract had nowhere to park the crude oil, and buyers at zero and below wound up scrambling for an exit as the price plunged on that fateful day. Brent crude oil, a seaborne oil, fell to its lowest price of this century at $16 per barrel in late April.
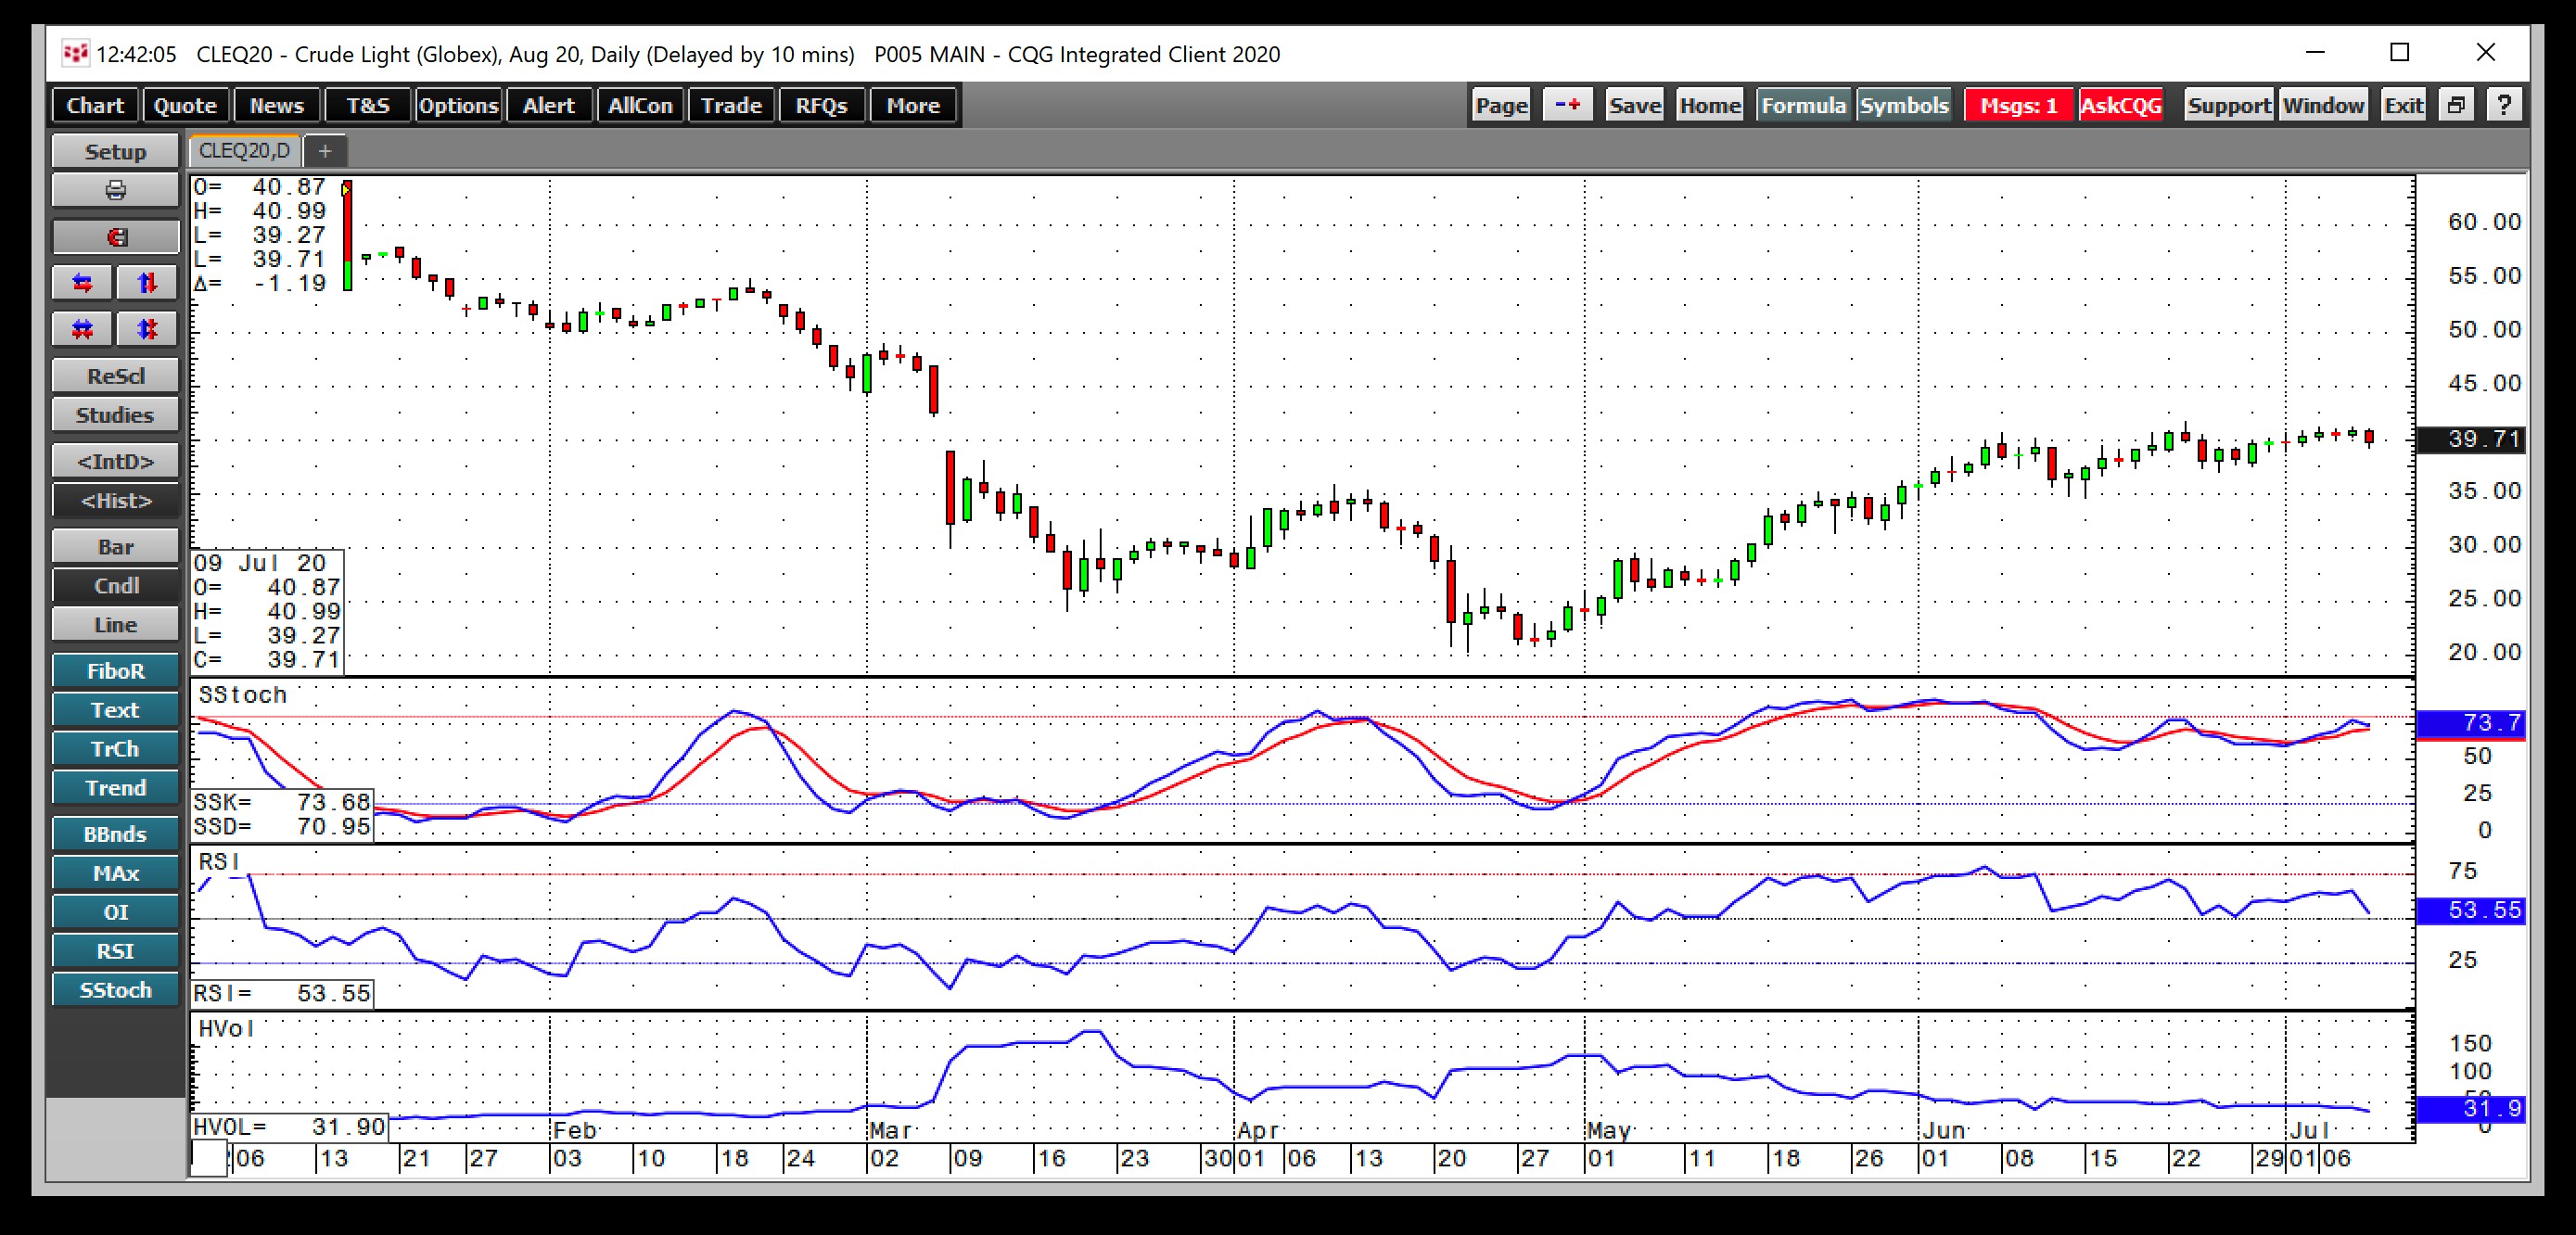
Meanwhile, the bottom on the now active month August contract came on April 22 at $20.28 per barrel. Since then, the price more than doubled at the most recent high at $41.63 on June 23. It has yet to fill the gap on the daily chart from March at $42.17. Crude oil was sitting trading on either side of the $40 per barrel level last week. While the trend since April remains bullish, the price has run out of some of its upside steam. The United States Crude Oil Fund (NYSE:USO) is an ETF product that tracks a portfolio of nearby NYMEX WTI futures.
Higher lows and higher highs since April, the consolidation
Crude oil took an elevator shaft to the downside from February through April. Since then, it has been on a staircase higher.

The daily chart of August NYMEX futures shows that crude oil has made higher lows and higher highs since trading at just over $20 per barrel on April 22. The price reached $40 per barrel in mid-June. While the energy commodity hit a high of $41.63 on June 23, it has struggled with the $40 level over the past weeks.
Price momentum and relative strength indicators rose from oversold conditions in April. The slow stochastic was in the lower region of overbought territory at the end of last week, with relative strength at above a neutral reading. Daily historical volatility peaked at over 178.5% in March, but the metric declined to 32.9% at the end of last week. Crude oil has been consolidating since it stopped making higher highs in June, and the $40 per barrel level has become a pivot point for the August futures.
Open interest sends a message, inventories rose again last week
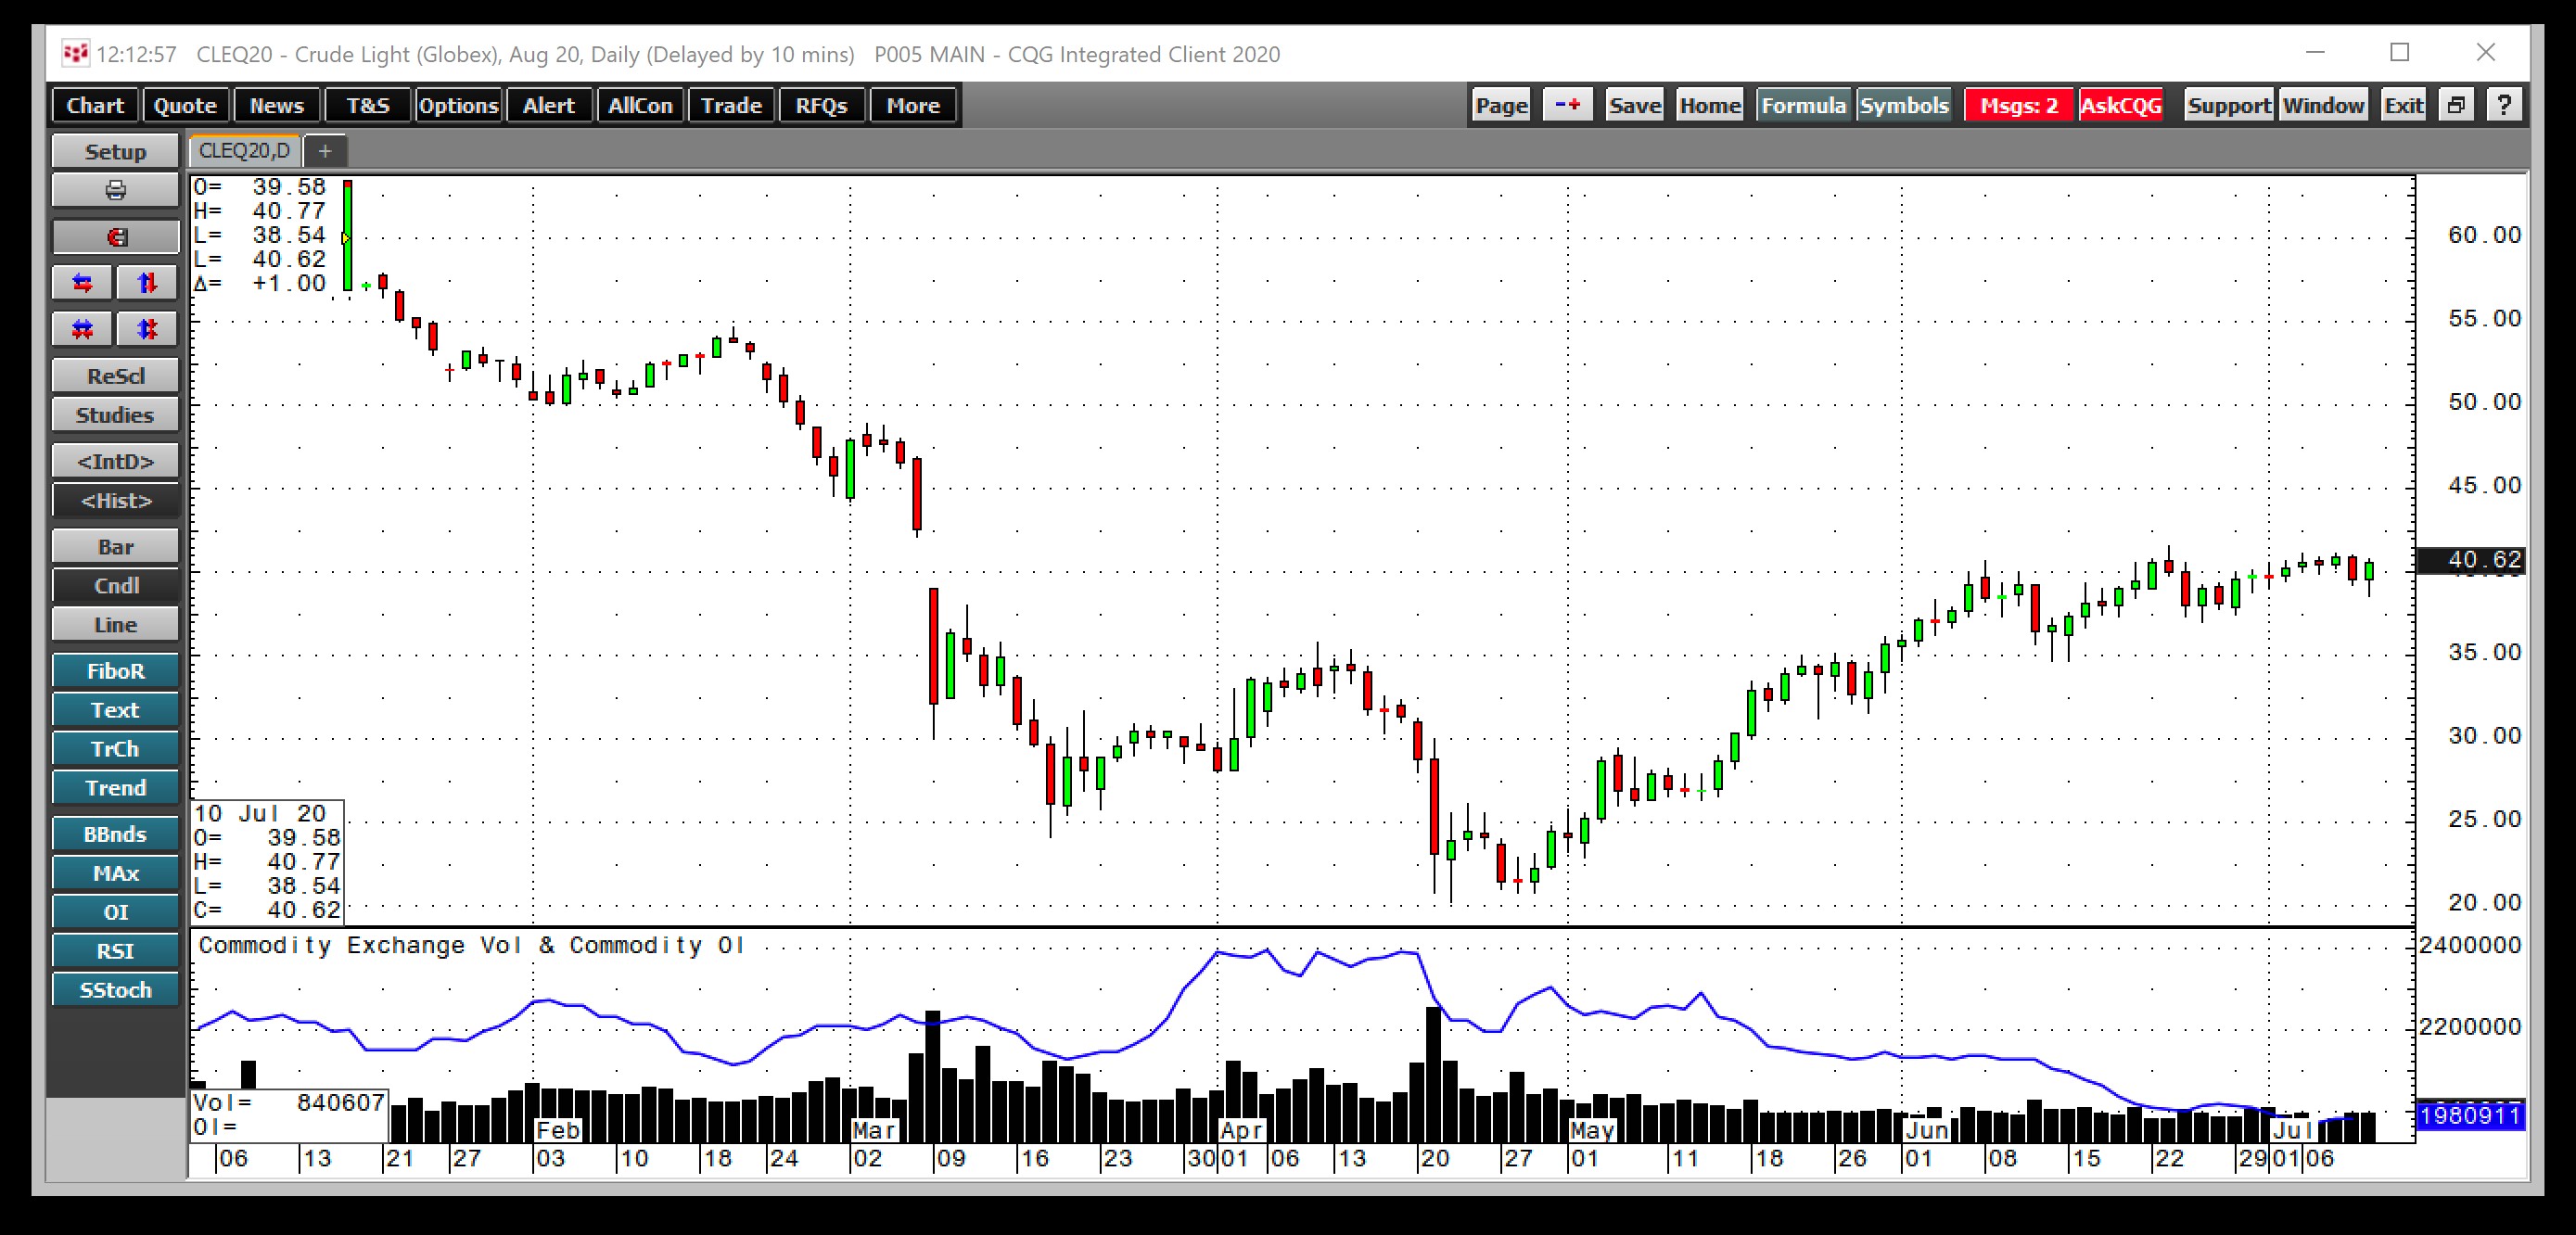
Open interest is the total number of open long and short positions in a futures market. The level of the metric is an indicator of hedging and speculative activity.

Source: CQG
The chart shows that open interest peaked at the 2.392 million contract level in early April. As of the end of last week, open interest stood at 1.981 million contracts, a decline of 17.2%. The metric steadily dropped while the price moved higher, which is not typically a technical validation of a bullish trend in a futures market. The first technical support level for August futures stands at $34.66 per barrel, the June 15 low.
Meanwhile, last week’s inventory data from the American Petroleum Institute and Energy Information Administration was not supportive of the price of the energy commodity. The API said that crude oil stockpiles in the US rose by 2.048 million barrels for the week ending on July 3. The market had expected a decline of 3.114 million barrels for the period. The EIA reported an increase of 5.70 million barrels for the same period. While product stocks moved mostly lower, the crude oil data was not bullish, sending the price below the $40 per barrel level before it recovered at the end of last week.
Decline in open interest as price rises
OPEC, Russia, and the US would like to see the price of crude oil remain steady at the $40 per barrel level. They extended the 9.7 million barrel per day production cut until the end of July, and another extension is likely on the horizon, given the fragile price. US production has declined from a record 13.1 million barrels per day in March to 11 mbpd as of July 3. At the same time, the number of oil rigs operating in the US was 603 lower at the end of last week compared to the same time in 2019.
The $40 per barrel level in the NYMEX crude oil futures market is an inflection point. The decline in open interest as the price rose, and the increase in oil stockpiles is not a bullish sign for the energy commodity. A pullback to the $35 per barrel level could be healthy. It would encourage OPEC, Russia, and other producers to extend the output cuts, which continue to be necessary to balance the supply and demand fundamentals of the oil market.
