
Summary- The Federal Reserve argues that the labor market is at/near full employment and that prices are at/near its preferred 2% level.
- It states - in no uncertain terms - that it will continue to raise interest rates gradually.
Before we look at the yield curve, let's examine the relative points from the Fed's Monetary Policy Report which it submitted to Congress this week. This document provides an analysis of the Fed's current interpretation of the economic data along with the Fed's policy projections.
Let's start with the economic data, analyzing the economy from the perspective of the Fed's dual mandate: maximum employment and price stability.
The labor market. The labor market has continued to strengthen. Over the first six months of 2018, payrolls increased an average of 215,000 per month, which is somewhat above the average pace of 180,000 per month in 2017 and is considerably faster than what is needed, on average, to provide jobs for new entrants into the labor force. The unemployment rate edged down from 4.1 percent in December to 4.0 percent in June, which is about 1/2 percentage point below the median of FOMC participants' estimates of its longer-run normal level. Other measures of labor utilization were consistent with a tight labor market. However, hourly labor compensation growth has been moderate, likely held down in part by the weak pace of productivity growth in recent years.
The Fed looks at the labor market from a number of angles. One of the best is to convert the monthly change in payrolls to moving averages, which removes the statistical noise caused by monthly gyrations.

Above, I've converted data from the St. Louis Federal Reserve's FRED system into 3-, 6-, and 12-month moving averages of growth in the establishment data. All three moving averages are now right around 200,000, which is a very high level for an expansion that is eight years old.
Another key metric is the 4-week moving average of initial jobless claims. This data shows the back-end of the jobs market - when employees are fired. This demonstrates how attached business is to labor, which is almost always the largest cost for a business:

Here I've used Federal Reserve data and added a 26- and 52-week moving average. The overall number is very low; in fact, it's at its lowest level since the late 1960s. Right now, business is very attached to their employees right now.
Turning to inflation, the report contained the following assessment of the PCE price index, the Fed's preferred gauge of pricing pressure:
Inflation. Consumer price inflation, as measured by the 12-month percentage change in the price index for personal consumption expenditures, moved up from a little below the FOMC's objective of 2 percent at the end of last year to 2.3 percent in May, boosted by a sizable increase in consumer energy prices. The 12-month measure of inflation that excludes food and energy items (so-called core inflation), which historically has been a better indicator of where overall inflation will be in the future than the total figure, was 2 percent in May. This reading was 1/2 percentage point above where it had been 12 months earlier, as the unusually low readings from last year were not repeated. Measures of longer-run inflation expectations have been generally stable.
Here's a chart of the data:

Low price pressures confounded the Fed (along with other central bankers) for most of this expansion. It now appears that in the U.S. prices have returned to the Fed's stated 2% objective.
And finally, here's the Fed's assessment of protected growth, via GDP, consumer spending, exports and business investment:
Economic growth. Real gross domestic product (GDP) is reported to have increased at an annual rate of 2 percent in the first quarter of 2018, and recent indicators suggest that economic growth stepped up in the second quarter. Gains in consumer spending slowed early in the year, but they rebounded in the spring, supported by strong job gains, recent and past increases in household wealth, favorable consumer sentiment, and higher disposable income due in part to the implementation of the Tax Cuts and Jobs Act. Business investment growth has remained robust, and indexes of business sentiment have been strong. Foreign economic growth has remained solid, and net exports had a roughly neutral effect on real U.S. GDP growth in the first quarter. However, activity in the housing market has leveled off this year.
The latest projection from the Atlanta Fed has 2Q18 GDP growth in the upper 3% range while the NY Fed is projecting the upper 2%. While there is some newly emerging weakness in the leading indicators, there is no reason to conclude that a recession is imminent. The Fed is on solid ground in arguing that growth will continue to be strong for the foreseeable future.
Finally, the Fed predicts gradual interest rate increases for the next few years:
The FOMC expects that further gradual increases in the target range for the federal funds rate will be consistent with a sustained expansion of economic activity, strong labor market conditions, and inflation near the Committee's symmetric 2 percent objective over the medium term. Consistent with this outlook, in the most recent Summary of Economic Projections (SEP), which was compiled at the time of the June FOMC meeting, the median of participants' assessments for the appropriate level for the federal funds rate rises gradually over the period from 2018 to 2020 and stands somewhat above the median projection for its longer-run level by the end of 2019 and through 2020. (The June SEP is presented in Part 3 of this report). However, as the Committee has continued to emphasize, the timing and size of future adjustments to the target range for the federal funds rate will depend on the Committee's assessment of realized and expected economic conditions relative to its maximum-employment objective and its symmetric 2 percent inflation objective.
This is as direct a statement as the Fed could make on the subject of interest rate policy.
Turning to the yield curve, there hasn't been much overall movement in the last six weeks:


The top chart compares the yield curve from July 2 to that of July 13; the bottom chart does the same for the period June 1-July 13. Neither shows any material difference. The real change has occurred since January:
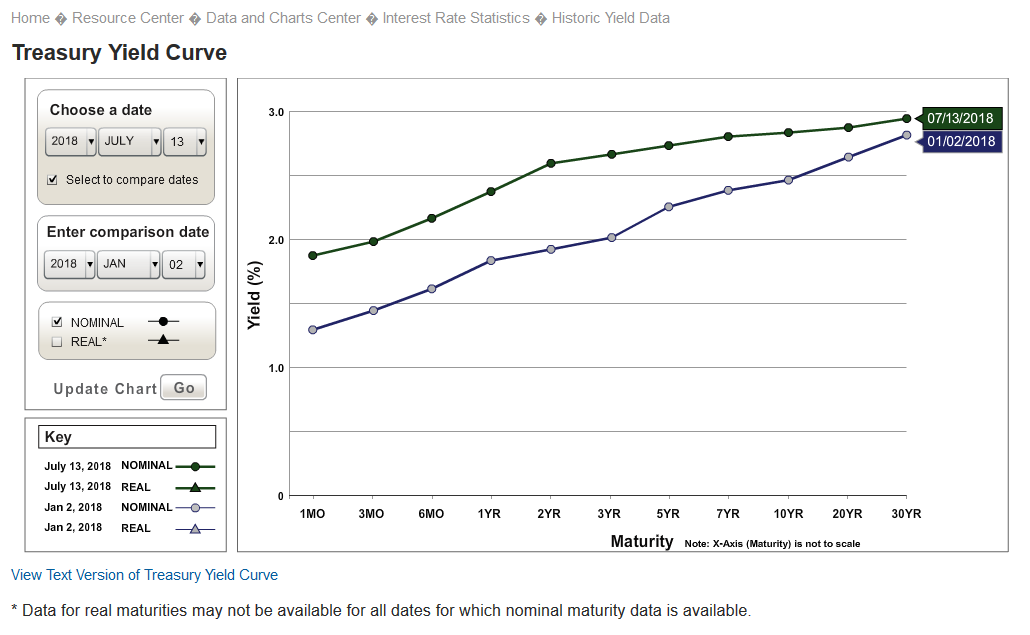
The short end of the curve is significantly higher since the first of the year. The long end, not so much.
And speaking of the rising short end, much ink (digital and otherwise) has been spilled over the compressing yield curve. Just last week, the FT reported that the gap between the 2- and 10-year Treasury bond was the lowest since August 2007. But does this really mean a recession is on the horizon? Stephen Williamson over at the New Monetarist Economics argues, no. What he argues is that the real rate to analyze is the 3-month T-Bill rate less inflation:

He notes that recessions happen when inflation is higher than the 3-month T-Bill rate, which definitely isn't occurring right now. You should definitely read the entire post; it's well worth your time.
Disclosure:I/we have no positions in any stocks mentioned, and no plans to initiate any positions within the next 72 hours.