
Crane Co. (NYSE:CR) kept its earnings steak alive in the first quarter of 2018, reporting better-than-expected results. Adjusted earnings for the quarter came in at $1.31 per share, surpassing the Zacks Consensus Estimate of $1.27. Also, the bottom line increased 24.8% from the year-ago tally of $1.05.
The company’s revenues totaled a record $799.1 million, up 18.7% year over year. However, the reported figure missed the Zacks Consensus Estimate of $805 million. The improvement in the metric was driven by a 15% benefit from acquired assets and a 4% gain from favorable foreign currency movements, partially offset by 1% decline in core sales.
At the quarter end, total order backlog was $976.8 million, up an impressive 38.4% year over year.
Segmental Details
Crane generates revenues from its four segments, which are briefly discussed below.
Crane Company Price, Consensus and EPS Surprise
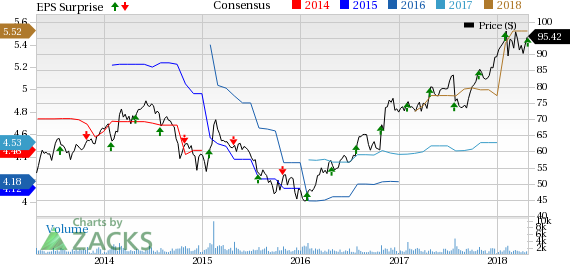
Crane Company Price, Consensus and EPS Surprise | Crane Company Quote
Revenues from Aerospace & Electronics segment totaled $170.4 million, up 4.3% year over year. It represented 21.3% of first-quarter revenues. Order backlog was $381.2 million, up 8.2% year over year.
Payment & Merchandising Technologies segment generated revenues of $292.4 million, up 49% year over year. It represented 36.5% of first-quarter revenues. Order backlog was $301 million (including backlog related to the acquired Crane Currency business and Microtronic business) compared with $85.8 million in the prior-year quarter.
Engineered Materials segment’s revenues were $69.7 million, down 6.7% year over year. It represented 8.8% of first-quarter revenues. Order backlog at the segment decreased 24.7% year over year to $13.4 million.
Revenues from Fluid Handling increased 11.3% year over year to $266.6 million. It represented 33.4% of first-quarter revenues. Order backlog was $281.2 million, up 12.6% year over year.
Costs & Margins
In the reported quarter, Crane’s cost of goods sold increased 21.4% year over year. The same metric, as a percentage of revenues, came in at 65.2% compared with 63.8% in the prior-year quarter. Selling, general and administrative expenses, as a percentage of revenues, were 22.2% compared with 21.9% in the year-ago quarter.
Operating margin, before special items, expanded 80 bps year over year to 12.1%. Operating margin was 10.5%, up 30 bps from the year-ago quarter.
Balance Sheet and Cash Flow
As of Mar 31, 2018, Crane’s cash and cash equivalents were $642.3 million than $504.8 million in the year-ago quarter. Long-term debt increased to $1,138.5 million from $494.1 million as of Dec 31, 2017.
In the quarter, the company’s net cash generated from operating activities totaled $74.2 million compared with $3.5 million in the year-ago quarter. Free cash flow was $46.7 million in the same period. Dividend paid in the quarter was approximately $20.9 million.
Concurrent with the earnings release, Crane announced that its board of directors has approved the payment of a quarterly dividend of 35 cents to shareholders for second-quarter 2018. The dividend will be paid on Jun 8, 2018.
Outlook
For 2018, Crane anticipates earnings, excluding special items, to be within the $5.45-$5.65 per share range compared with $5.35-$5.55 guided earlier. GAAP earnings are envisioned to be in the band of $4.75-$4.95 than the earlier projected range of $4.65-$4.85 per share.
Free cash flow is projected to lie within the $240-$270 million range compared with 220-$250 million anticipated earlier.
Zacks Rank & Key Picks
Crane carries a Zacks Rank #2 (Buy). Some other top-ranked stocks in the same space include Federal Signal Corp. (NYSE:FSS) , Raven Industries, Inc. (NASDAQ:RAVN) and Danaher Corp. (NYSE:DHR) . While Federal Signal sports a Zacks Rank #1 (Strong Buy), Raven Industries and Danaher carry the same bullish rank as Crane. You can see the complete list of today’s Zacks #1 Rank stocks here.
Federal Signal has an impressive earnings surprise history. The company outpaced estimates in the trailing four quarters, with an average beat of 16.5%.
Raven Industries has a modest earnings surprise history. The company exceeding estimates thrice in the trailing four quarters, with an average beat of 20.2%.
Danaher has an excellent earnings surprise history. The company surpassed estimates in the trailing four quarters, with an average beat of 4.1%.
Will You Make a Fortune on the Shift to Electric Cars?
Here's another stock idea to consider. Much like petroleum 150 years ago, lithium power may soon shake the world, creating millionaires and reshaping geo-politics. Soon electric vehicles (EVs) may be cheaper than gas guzzlers. Some are already reaching 265 miles on a single charge.
With battery prices plummeting and charging stations set to multiply, one company stands out as the #1 stock to buy according to Zacks research.
It's not the one you think.
Danaher Corporation (DHR): Free Stock Analysis Report
Raven Industries, Inc. (RAVN): Free Stock Analysis Report
Federal Signal Corporation (FSS): Free Stock Analysis Report
Crane Company (CR): Free Stock Analysis Report
Original post
Zacks Investment Research