If you have been following our research over the past few months, you already know that we've called just about every major move in gold over the past 14+ months. Recently, we called for gold to rally to the $1,300 area, establish a minor peak, stall and retrace back to setup a momentum base pattern. We predicted this move to take place back in January 2019 – nearly 30+ days before it happened.
Now, we are publishing this research post to alert you that we are about 15-30 days away from the momentum base setup in gold, which will likely mirror in silver. Thus, we have about 20+ days to look for and target entry opportunities in both gold and silver before this momentum bottom/base sets up.
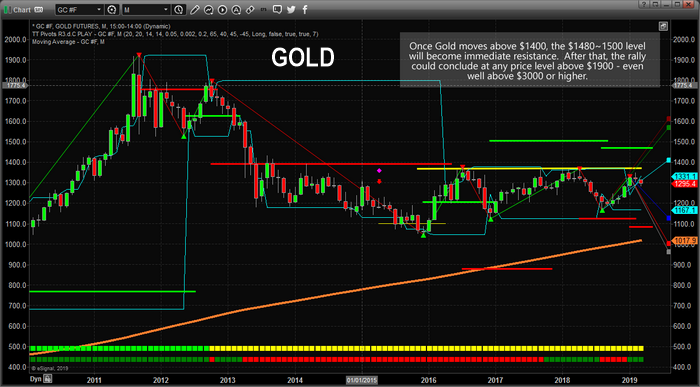
The monthly gold chart below shows the historic peaks that make up a current resistance level near 1,370. This level is critical in understanding how the momentum base and following breakout will occur. This resistance level must be broken before the upside rally can continue above $1,400, then $1,500. Ultimately, the momentum base we are expecting to form before April 21 is the “last base” to setup before a much bigger upside price move takes place. In other words, pay attention over the next 30 days before this move happens.
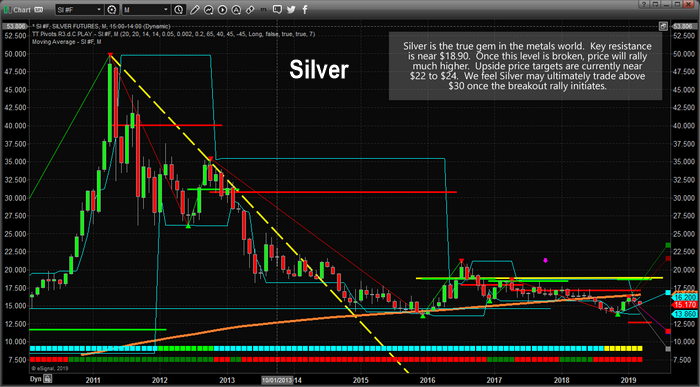
This next monthly silver chart is the real gem of the precious-metals world. Silver's upside potential is actually much bigger than gold's. Any breakout move will likely see silver push well above $30 per ounce and we just need to watch the $18.90 level for signs that the breakout is beginning. Silver will follow a similar basing patter as gold. We expect only about 30 days of buying opportunity left before this basing pattern is completed. Again, watch the April 21 date as the key date for the breakout move to begin.
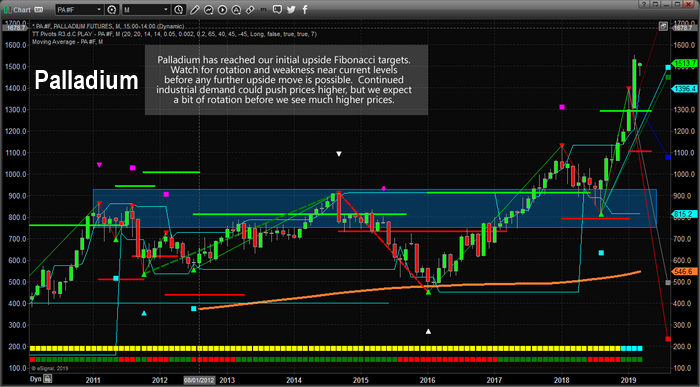
Palladium has reached our initial Fibonacci upside price targets. We expect price to consolidate and potentially rotate near the $1,500 price level. Ideally, price could fall below $1,300 and target $1,100 before finding any real support. As long as industrial demand continues for Palladium, we expect to see continued upside price activity over the long run. Right now, we are expecting a price contraction as global industrial demand may falter a bit.
Please consider the research we are presenting. Our predictive modeling systems have been calling the metals markets quite accurately over the past 14+ months. If our prediction of a momentum base on or near April 21 is correct, then we should begin to see an incredible upside price swing in gold and silver shortly after that date. You won't want to miss this one – trust us. There will be time to catch this move when it starts – it could be an extended upside move. Pay attention and put April 21 on your calendar now.


