
Here are the latest charts and statistics for the Commitment of Traders (COT) data published by the Commodities Futures Trading Commission (CFTC).
The latest COT data is updated through Tuesday Feb. 15 and shows a quick view of how large traders (for-profit speculators and commercial entities) were positioned in the futures markets.
Highlighting the COT soft commodities data is the recent turnaround in speculator sentiment for the sugar futures bets. The speculative net position in the sugar futures has fallen for three straight weeks and in ten out of the past 12 weeks. Overall, the net position has now decreased by a total of -170,063 net contracts over the past 12 weeks.
Sugar bullish bets had been on a strong uptrend from 2020 through 2021 with speculator bullish bets reaching a recent high of +302,267 net contracts on Aug. 17. Since then, contracts and sugar prices have cooled off and have started lower with the trend accelerating over the past few months. The slipping sentiment has pushed the current speculator standing for sugar to the lowest level of the past 91 weeks, dating back to May of 2020.
The soft commodities that saw higher bets this week were coffee (3,558 contracts), soybeans (7,002 contracts), soybean oil (1,285 contracts), soybean meal (3,284 contracts), live cattle (3,758 contracts), lean hogs (690 contracts) and cocoa (6,361 contracts).
The soft commodities that saw lower bets this week were corn (-5,110 contracts), sugar (-4,527 contracts), cotton (-3,487 contracts) and wheat (-2,268 contracts).
Corn Futures
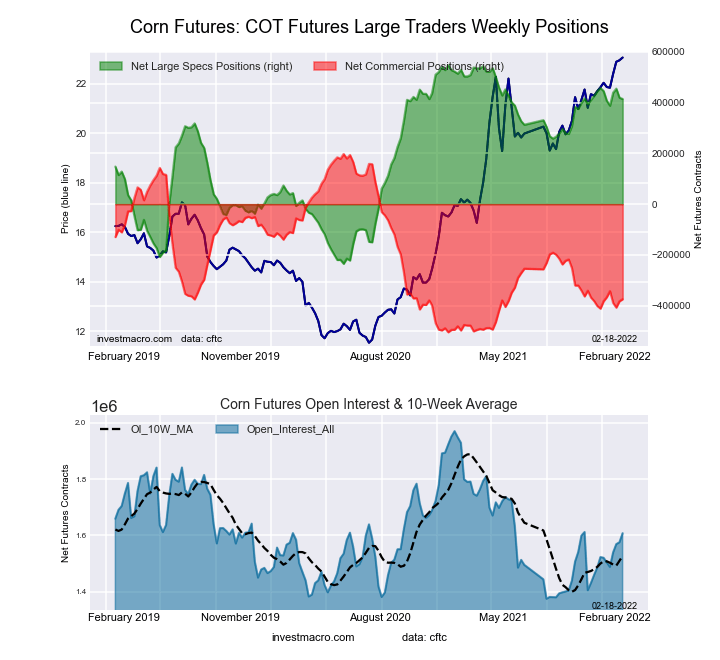
The corn large speculator standing this week totaled a net position of 414,492 contracts in the data reported through Tuesday. This was a weekly reduction of -5,110 contracts from the previous week which had a total of 419,602 net contracts.
This week’s current strength score (the trader positioning range over the past three years, measured from 0 to 100) shows the speculators are currently Bullish-Extreme with a score of 83.0 percent. The commercials are Bearish-Extreme with a score of 18.5 percent and the small traders (not shown in chart) are Bearish with a score of 20.3 percent.
Sugar Futures
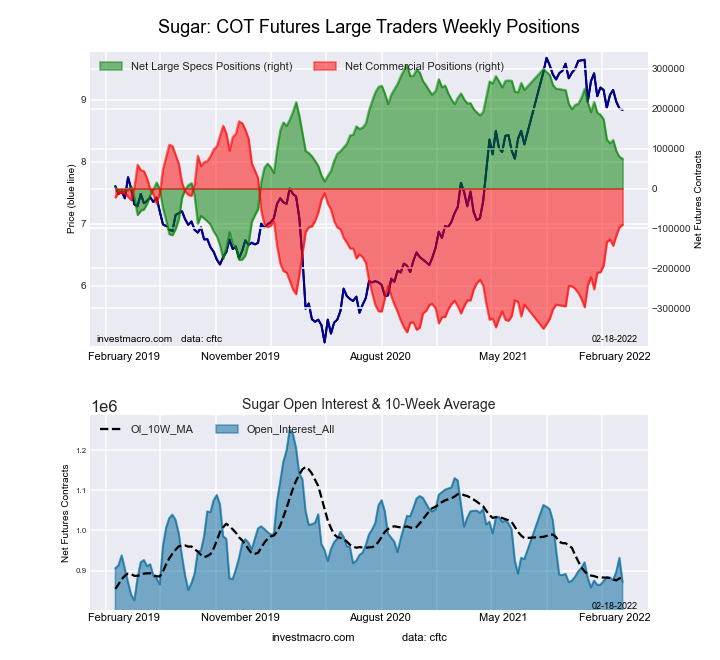
The sugar large speculator standing this week totaled a net position of 74,563 contracts in the data reported through Tuesday. This was a weekly decrease of -4,527 contracts from the previous week which had a total of 79,090 net contracts.
This week’s current strength score (the trader positioning range over the past three years, measured from 0 to 100) shows the speculators are currently Bullish with a score of 51.9 percent. The commercials are Bullish with a score of 51.0 percent and the small traders (not shown in chart) are Bearish with a score of 27.4 percent.
Coffee Futures
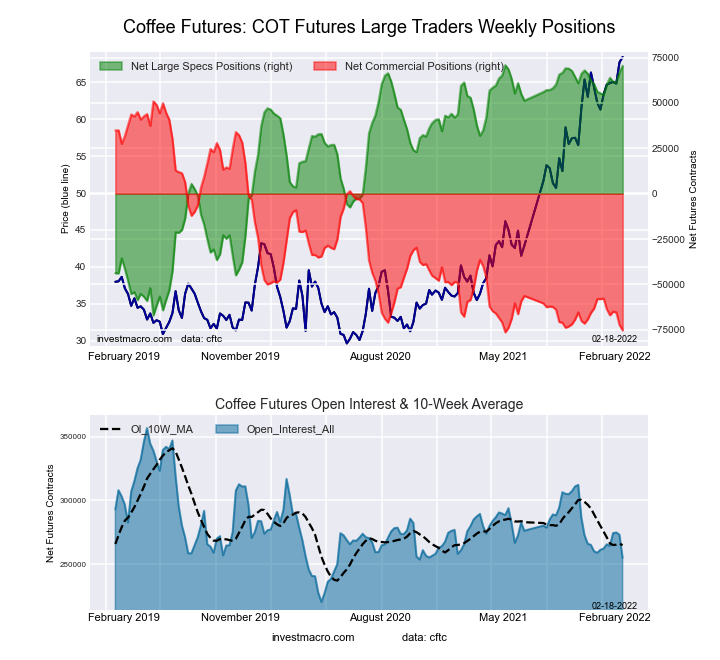
The coffee large speculator standing this week totaled a net position of 70,425 contracts in the data reported through Tuesday. This was a weekly advance of 3,558 contracts from the previous week which had a total of 66,867 net contracts.
This week’s current strength score (the trader positioning range over the past three years, measured from 0 to 100) shows the speculators are currently Bullish-Extreme with a score of 99.7 percent. The commercials are Bearish-Extreme with a score of 0.9 percent and the small traders (not shown in chart) are Bearish with a score of 21.6 percent.
Soybean Futures
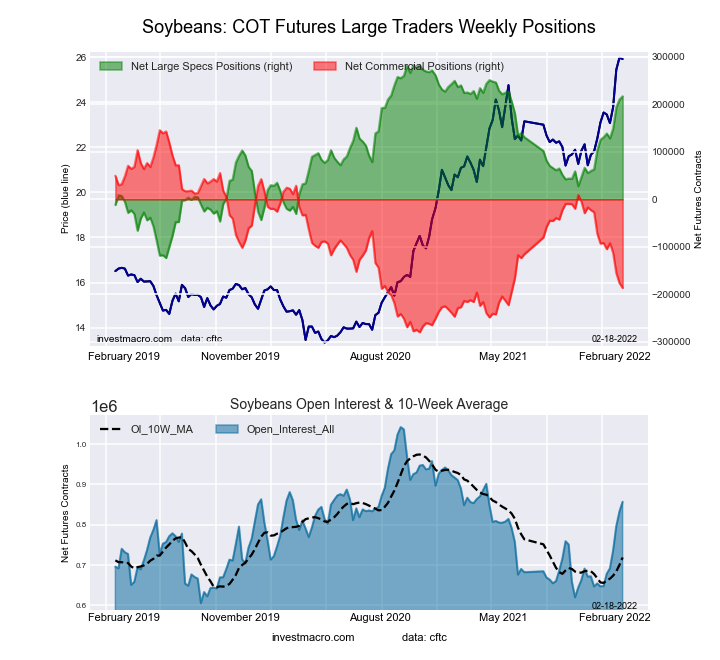
The soybeans large speculator standing this week totaled a net position of 216,732 contracts in the data reported through Tuesday. This was a weekly gain of 7,002 contracts from the previous week which had a total of 209,730 net contracts.
This week’s current strength score (the trader positioning range over the past three years, measured from 0 to 100) shows the speculators are currently Bullish-Extreme with a score of 83.9 percent. The commercials are Bearish with a score of 22.0 percent and the small traders (not shown in chart) are Bearish-Extreme with a score of 19.8 percent.
Soybean Oil Futures
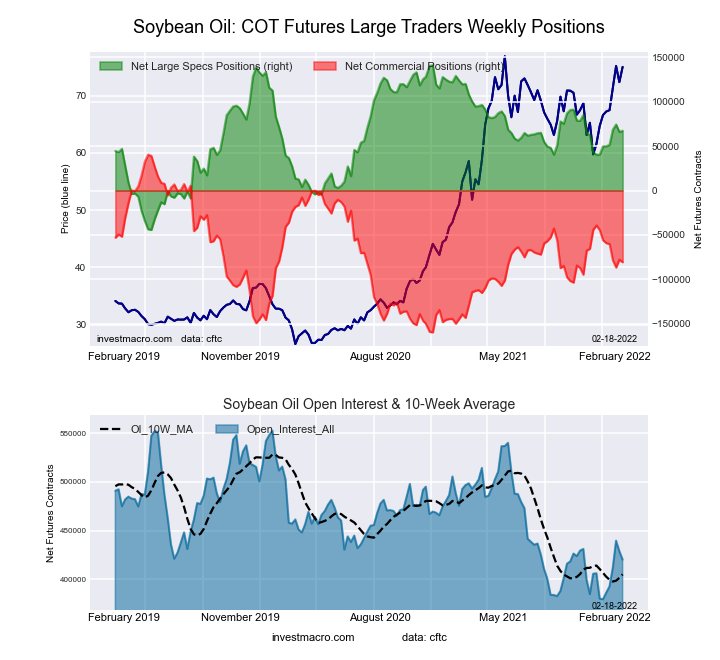
The soybean oil large speculator standing this week totaled a net position of 67,320 contracts in the data reported through Tuesday. This was a weekly advance of 1,285 contracts from the previous week which had a total of 66,035 net contracts.
This week’s current strength score (the trader positioning range over the past three years, measured from 0 to 100) shows the speculators are currently Bullish with a score of 60.2 percent. The commercials are Bearish with a score of 39.5 percent and the small traders (not shown in chart) are Bullish with a score of 63.2 percent.
Soybean Meal Futures
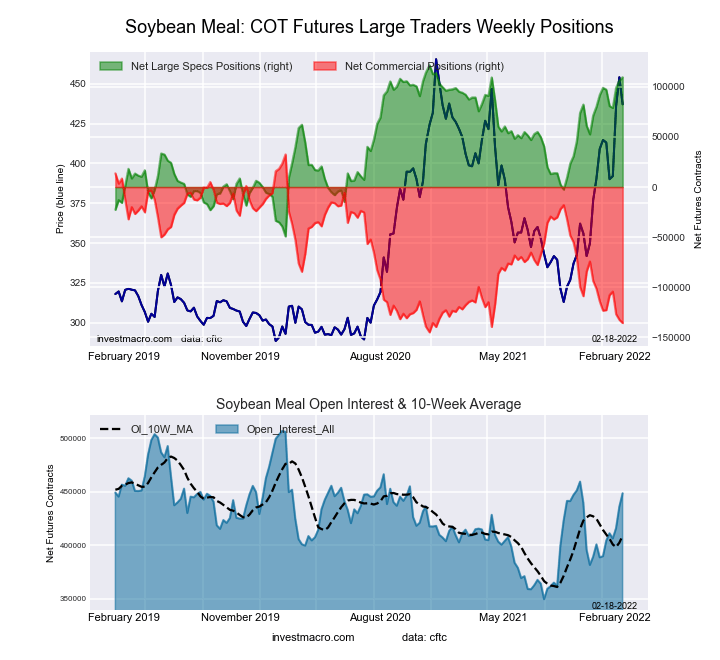
The soybean meal large speculator standing this week totaled a net position of 109,544 contracts in the data reported through Tuesday. This was a weekly gain of 3,284 contracts from the previous week which had a total of 106,260 net contracts.
This week’s current strength score (the trader positioning range over the past three years, measured from 0 to 100) shows the speculators are currently Bullish-Extreme with a score of 92.9 percent. The commercials are Bearish-Extreme with a score of 5.2 percent and the small traders (not shown in chart) are Bullish with a score of 75.7 percent.
Live Cattle Futures
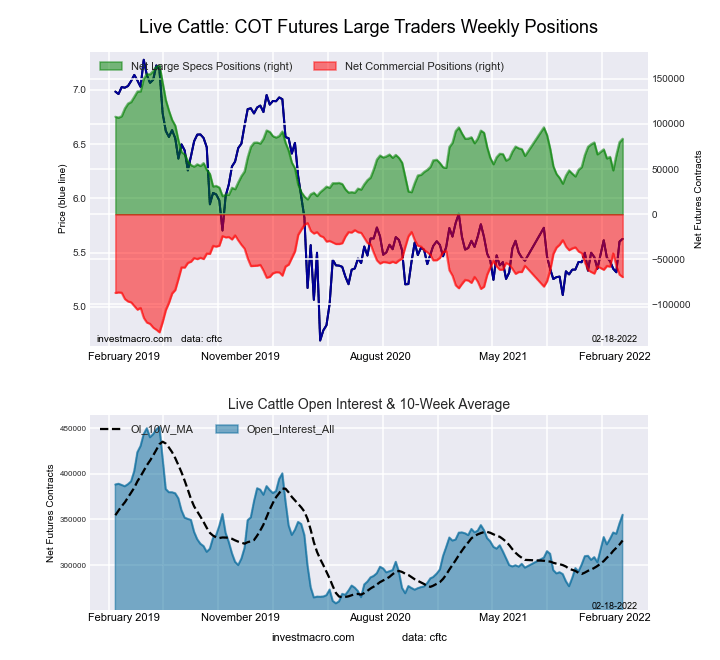
The live cattle large speculator standing this week totaled a net position of 83,567 contracts in the data reported through Tuesday. This was a weekly lift of 3,758 contracts from the previous week which had a total of 79,809 net contracts.
This week’s current strength score (the trader positioning range over the past three years, measured from 0 to 100) shows the speculators are currently Bearish with a score of 45.1 percent. The commercials are Bullish with a score of 50.5 percent and the small traders (not shown in chart) are Bullish with a score of 53.2 percent.
Lean Hogs Futures
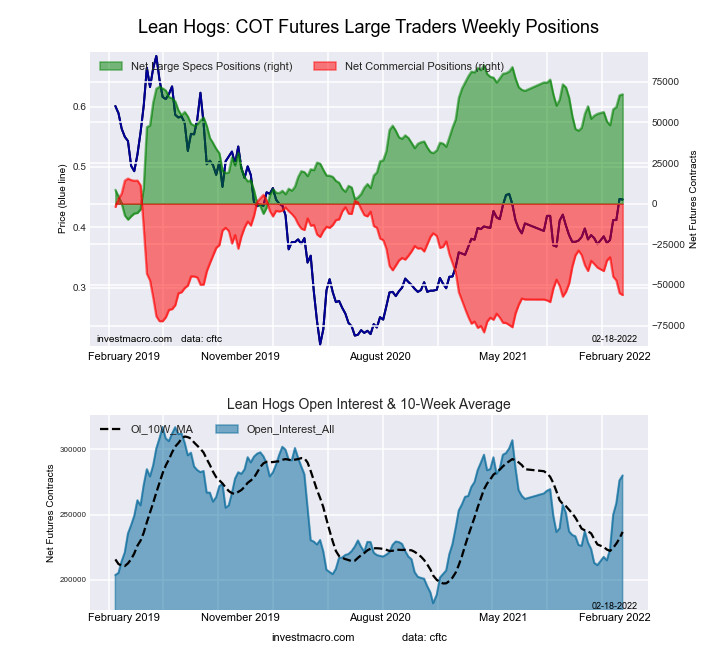
The lean hogs large speculator standing this week totaled a net position of 67,332 contracts in the data reported through Tuesday. This was a weekly gain of 690 contracts from the previous week which had a total of 66,642 net contracts.
This week’s current strength score (the trader positioning range over the past three years, measured from 0 to 100) shows the speculators are currently Bullish-Extreme with a score of 80.1 percent. The commercials are Bearish with a score of 24.6 percent and the small traders (not shown in chart) are Bearish with a score of 31.8 percent.
Cotton Futures
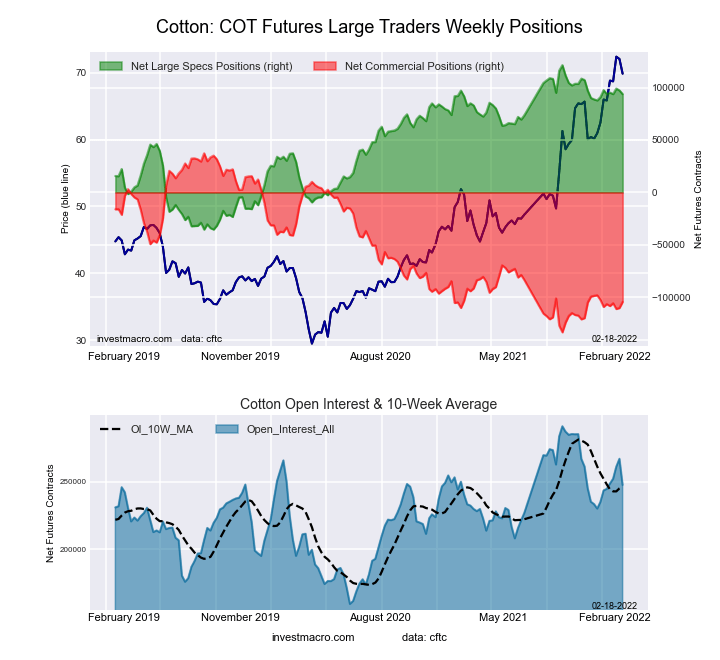
The cotton large speculator standing this week totaled a net position of 93,723 contracts in the data reported through Tuesday. This was a weekly decline of -3,487 contracts from the previous week which had a total of 97,210 net contracts.
This week’s current strength score (the trader positioning range over the past three years, measured from 0 to 100) shows the speculators are currently Bullish-Extreme with a score of 82.4 percent. The commercials are Bearish-Extreme with a score of 17.0 percent and the small traders (not shown in chart) are Bullish with a score of 79.5 percent.
Cocoa Futures
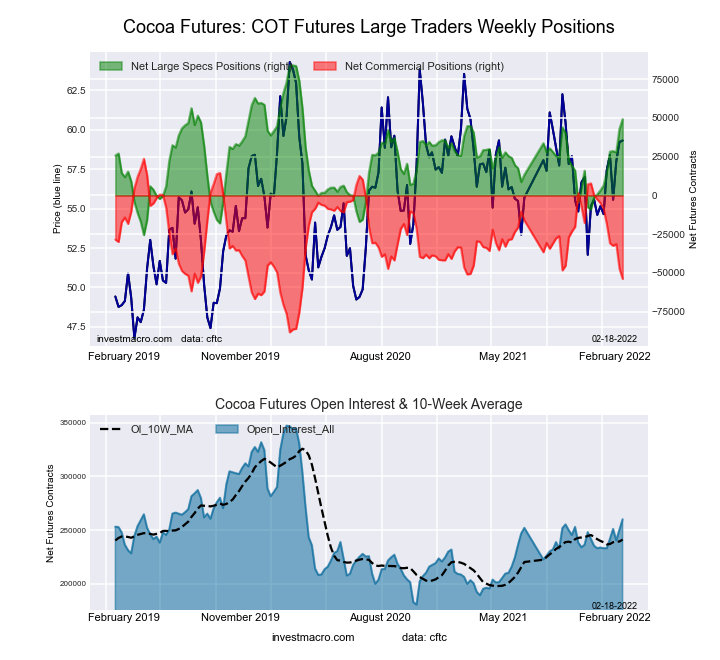
The cocoa large speculator standing this week totaled a net position of 49,216 contracts in the data reported through Tuesday. This was a weekly rise of 6,361 contracts from the previous week which had a total of 42,855 net contracts.
This week’s current strength score (the trader positioning range over the past three years, measured from 0 to 100) shows the speculators are currently Bullish with a score of 68.2 percent. The commercials are Bearish with a score of 30.8 percent and the small traders (not shown in chart) are Bullish with a score of 60.9 percent.
Wheat Futures
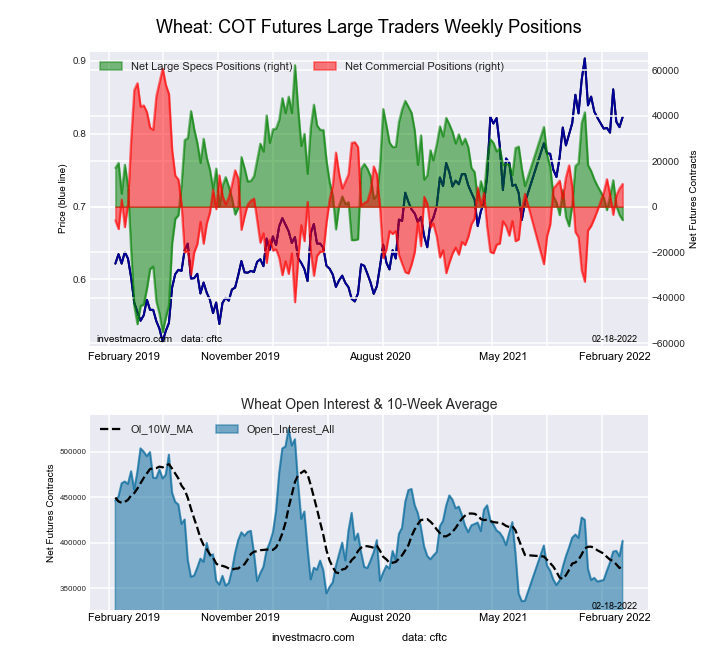
The wheat large speculator standing this week totaled a net position of -5,846 contracts in the data reported through Tuesday. This was a weekly fall of -2,268 contracts from the previous week which had a total of -3,578 net contracts.
This week’s current strength score (the trader positioning range over the past three years, measured from 0 to 100) shows the speculators are currently Bearish with a score of 42.0 percent. The commercials are Bullish with a score of 50.6 percent and the small traders (not shown in chart) are Bullish-Extreme with a score of 81.7 percent.
*COT Report: The COT data, released weekly to the public each Friday, is updated through the most recent Tuesday (data is 3 days old) and shows a quick view of how large speculators or non-commercials (for-profit traders) were positioned in the futures markets.
The CFTC categorizes trader positions according to commercial hedgers (traders who use futures contracts for hedging as part of the business), non-commercials (large traders who speculate to realize trading profits) and nonreportable traders (usually small traders/speculators) as well as their open interest (contracts open in the market at time of reporting).See CFTC criteria here.