The following futures positions of non-commercials are as of February 27, 2018.
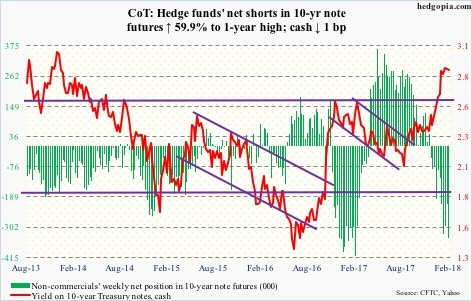
10 Year Note Futures: Currently net short 342.9k, up 128.4k.
On February 5 when Jerome Powell took over as Fed chair the S&P 500 large cap index dropped 4.1 percent, and 10-Year Treasury yields fell six basis points to 2.79 percent. In all probability, the rout in stocks in that session was a mere coincidence.
On Tuesday this week, Mr. Powell delivered his Humphrey Hawkins testimony to the Congress. The S&P 500 dropped again, down 1.3 percent, but 10-year yields this time around jumped five basis points to 2.91 percent. This probably was not a coincidence.
Markets took “My personal outlook for the economy has strengthened since December” to mean that he was leaning more hawkish than expected, suggesting four 25-basis-point hikes in the fed funds rate this year. Thursday, he tried to walk it back saying “there is no evidence the economy is currently overheating” but investor nerves were not soothed.
A four-hike scenario would represent an acceleration in the pace of tightening.
Since December 2015 when the Fed began raising rates, there have only been five hikes. As of last December, the FOMC dot plot expected three hikes this year. The members will update their forecast in the March 20-21 meeting.
Further, the Fed is also reducing its mammoth $4.4-trillion balance sheet, which got off the ground with $10 billion a month in October-December last year, then accelerating the pace every three months. By this October, this could rise to $50 billion a month. In due course, this can begin to bite, more so if short rates rise faster. Hence the nervous markets. They will be on pins and needles until at least the March meeting.
In the meantime, non-commercials continue to bet on higher 10-year yields.
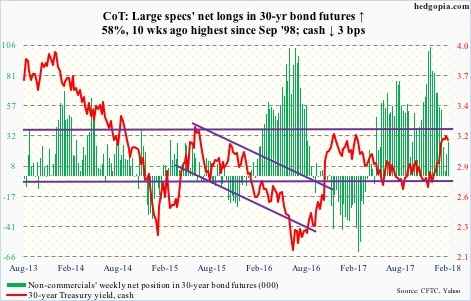
30 Year Bond Futures: Currently net long 27.5k, up 10.1k.
Major economic releases next week are as follows.
February’s ISM non-manufacturing index will be published Monday. Services activity expanded 3.9 points month-over-month in January to record 59.9 (data only goes back to January 2008.)
January’s revised and more detailed estimates of durable goods data are due out Tuesday. Preliminarily, orders for non-defense capital goods ex-aircraft – proxy for business capex plans – rose 6.3 percent year-over-year to a seasonally adjusted annual rate of $66.7 billion – slower than 9.9-percent growth last October. Orders peaked at $70.3 billion in September 2014 and bottomed at $59.9 billion in May 2016.
Wednesday brings revised productivity data for 4Q17. The preliminary estimate showed non-farm output per hour rose 1.06 percent y/y in 4Q17. This was the slowest pace in four quarters. Productivity remains anemic.
Employment numbers for February will be reported Friday. Average hourly earnings of private-sector employees rose 2.89 percent y/y in January – the highest growth rate since May 2009. The last time earnings grew with a three handle was in April that year.
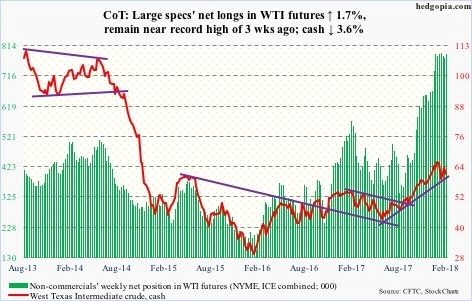
Crude Oil WTI Futures: Currently net long 787.1k, up 13.5k.
Resistance at $63-$64 on the cash ($61.25/barrel) proved tough to conquer. After Monday’s rejection, West Texas Intermediate crude proceeded to lose the 50-day moving average Wednesday. There is decent support at $58-59/barrel, which was defended in the selloff last month.
The EIA report for the week ended February 23 offered no help to the bulls.
|U.S. crude production rose another 13,000 barrels per day to 10.3 million b/d. Ditto with crude imports, which increased 261,000 b/d to 7.3 mb/d. As did crude and gasoline stocks, up three million barrels and 2.5 million barrels to 423.5 million barrels and 251.8 million barrels, respectively. Gasoline stocks are at a one-year high.
Refinery utilization dropped three-tenths of a percentage point to 87.8 percent. Utilization has been under pressure since peaking at 96.7 percent late December last year.
Distillate stocks, on the other hand, fell 960,000 barrels to 138 million barrels.
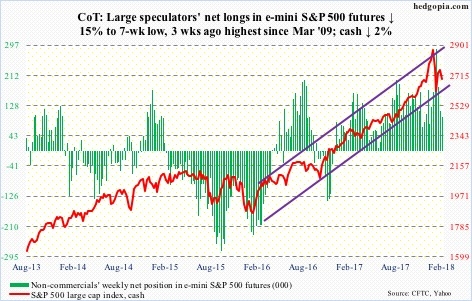
S&P 500 E-Mini Futures: Currently net long 96.3k, down 17k.
On the monthly chart, after January’s solid start to the year, February produced a hanging man on the cash (2691.25). This is potentially bearish medium term, and could form as an opportunity for the bears. Let us see how far they can take it. (All major U.S. indices carved out a monthly hanging man in February.)
During the week, the S&P 500 index retreated after hitting 2789.15 intraday Tuesday – a lower high versus the all-time high of 2872.87 on January 26. The 50-day (2736), which was lost Wednesday, attracted more sellers Thursday. The 200-day, which was defended in the selloff last month, lies at 2561.
At least until Wednesday, the weakness elicited inflows. In the week ended that session, SPDR S&P 500 (NYSE:SPY) took in $6.2 billion, ishares S&P 500 (NYSE:IVV) $1.3 billion and Vanguard S&P 500 (NYSE:VOO) $483 million (courtesy of ETF.com).
In the same week, U.S.-based equity funds (including ETFs) took in $13.3 billion (courtesy of Lipper).
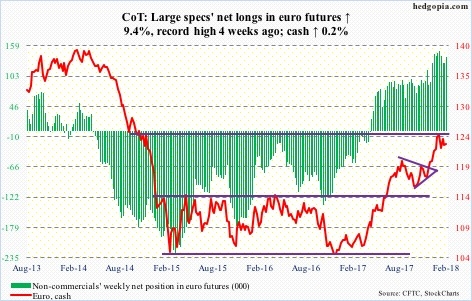
Euro Futures: Currently net long 138k, up 11.9k.
A falling trend line from the all-time high of $160.20 in April 2008 lies at/near $125 on the cash ($123.17). This level also represents measured-move-target resistance of a 10-point range breakout last July.
There were several unsuccessful attempts at that resistance over three weeks in January and February. The subsequent selloff stopped this Thursday after attracting bids at the daily lower Bollinger® band. The 50-day was lost intraday Thursday, but recaptured by close.
The daily chart is getting oversold. Resistance lies at $123.60, and after that $125.
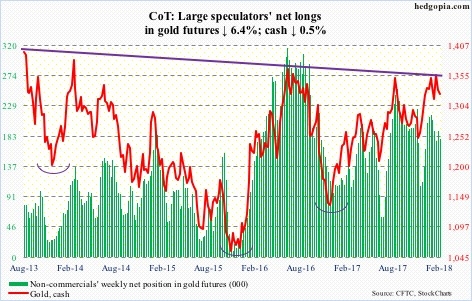
Gold Futures: Currently net long 178.7k, down 12.2k.
In the week ended Wednesday, SPDR Gold Shares (NYSE:GLD) and iShares Gold (NYSE:IAU) saw inflows to the tune of $191 million ($139 million and $52 million, in that order). This followed inflows of $262 million in the prior week (courtesy of ETF.com).
This did not help the cash ($1,323.40/ounce) much. Gold retreated after hitting $1,364.40 on February 16. A slightly falling trend line from August 2013 lies there. This level also approximates the neckline of a reverse-head-and-shoulders formation. Then there is Fibonacci resistance. The metal peaked in September 2011 at $1,923.70, then bottoming at $1,045.40 in December 2015. A 38.2-percent retracement of this decline lies at $1,380.91.
From gold bugs’ perspective, the good news is that they once again successfully defended support at $1,300 (low of $1,303.60 Thursday). The daily chart is itching to move higher.
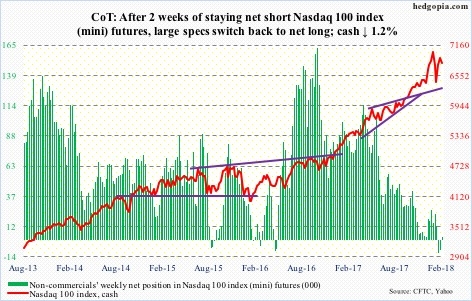
Nasdaq 100 Futures: Currently net long 2.8k, up 11.1k.
The selloff in the first seven sessions last month was brutal. The recovery since the February 9th low has been no less impressive. The cash (6811.04) this Tuesday came within 20 points of the all-time high of 7022.97 on January 26.
PowerShares QQQ Trust Series 1 (NASDAQ:QQQ) attracted $2.7 billion in the week through Wednesday (courtesy of ETF.com).
Thursday, the bulls defended the 50-day. An intraday breach of that average Friday was bought hand over fist.
That said, internals are not healthy. At the highs this week, Nasdaq new highs were 117 (closed at 64), versus 437 six weeks ago. Only the generals are leading, the soldiers are falling behind.
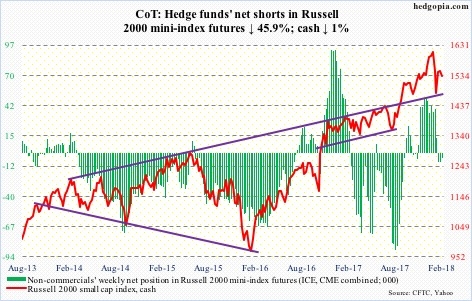
SmallCap 2000 Futures: Currently net short 4.5k, down 3.8k.
Since losing the 50-day (1550) a month ago, the cash (1533.17) managed to close above the average just once. That was this Monday. The 200-day (1471) lies underneath. Until either one of the two gives way, the Russell 2000 is trapped between these averages.
Relative to large-caps, small-caps have underperformed for a while now.
In the week to Wednesday, iShares Core S&P Small-Cap (NYSE:IJR) lost $28 million, while $190 million moved into iShares Russell 2000 (NYSE:IWM). Although year-to-date, flows remain tentative. Through Wednesday this year, IJR gained $126 million, but IWM lost $2.9 billion (courtesy of ETF.com).
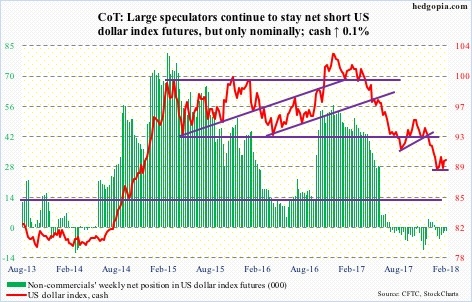
US Dollar Index Futures: Currently net short 2.1k, down 51.
The cash (89.91) arguably continues to form a base. Although this scenario is yet to be embraced by non-commercials.
This week, it rallied past short-term resistance at 90.50, but struggled to stay above. Thursday’s high of 90.89 came within 0.10 of the low of 90.99 on September 8 last year, before ending the session with an outside day. It also faced resistance at the 50-day (90.50).
Near term, the US dollar index likely heads lower. Short-term support lies at 89.40. Not to mention must-save support at 88-89.
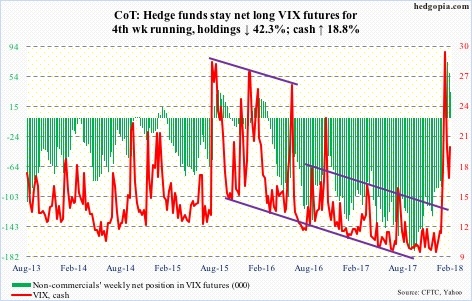
S&P 500 VIX Futures: Currently net long 34.4k, down 25.2k.
Volatility bulls did step up to the plate in defense of support at 15-16 on the cash. Wednesday’s intraday low of 15.29 also successfully tested the 50-day, which is now slightly rising. Friday produced a little spike reversal though, with VIX rising all the way to 26.22 intraday only to close at 19.59.
Back on February 6, VIX peaked at an intraday high of 50.30. Several times in the past, spike reversals subsequently resulted in drops all the way to the sub-10 or low-double-digit region. This time around – thus far – that has not been the case.
Thanks for reading!

