
Here are the latest charts and statistics for the Commitment of Traders (COT) data published by the Commodities Futures Trading Commission (CFTC).
The latest COT data is updated through Tuesday, Apr. 5 and shows a quick view of how large traders (for-profit speculators and commercial entities) were positioned in the futures markets. Highlighting the COT metals data is the recent decline in the Gold futures bets.
The speculative net position in the Gold futures dropped this week for the third time in the past four weeks and by a total of -28,847 contracts over that time frame. Gold spec positions had previously been on a strong run of rising weekly bullish bets and had increased for five straight weeks from Feb. 8 to Mar. 8 with a total gain of +102,246 contracts over that period.
That speculator sentiment strength brought positions to a sixty-one-week high with a net position of +274,388 contracts and coincided with the Gold price surging above the $2,050 level. Since then, bullish bets have cooled off while the Gold price has also taken a breather and fallen back into a trading range between approximately $1,920 and $1,960 where it currently resides.
Overall, the metals market that rose this week was just Copper (5,561 contracts) while Gold (-12,055 contracts), Platinum Futures (-2,711 contracts), Palladium Futures (-30 contracts) and Silver Futures (-3,206 contracts) all had lower bets on the week.
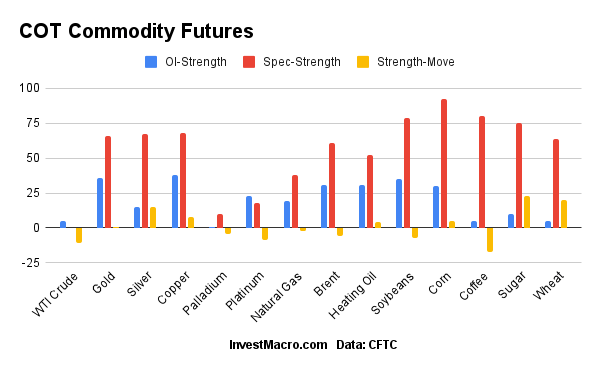
Speculator strength standings for each Commodity where strength index is current net position compared to past three years, above 80 is bullish extreme, below 20 is bearish extreme.
- OI Strength = Current Open Interest level compared to last 3 years range
- Spec Strength = Current Net Speculator level compared to last 3 years range
- Strength Move = Six-week change of Spec Strength
Gold Comex Futures
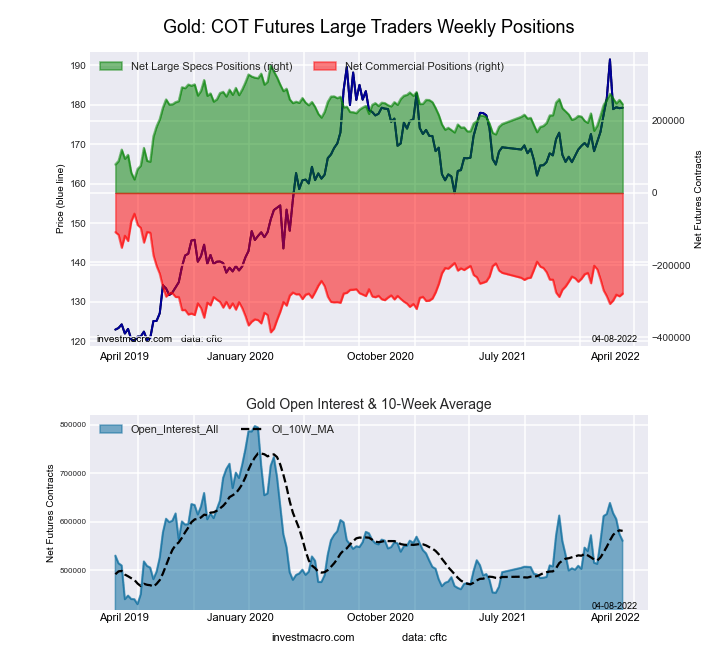
The Gold Comex Futures large speculator standing this week resulted in a net position of 245,541 contracts in the data reported through Tuesday. This was a weekly decline of -12,055 contracts from the previous week which had a total of 257,596 net contracts.
This week’s current strength score (the trader positioning range over the past three years, measured from 0 to 100) shows the speculators are currently Bullish with a score of 65.8 percent. The commercials are Bearish with a score of 32.6 percent and the small traders (not shown in chart) are Bullish with a score of 58.5 percent.
Silver Comex Futures
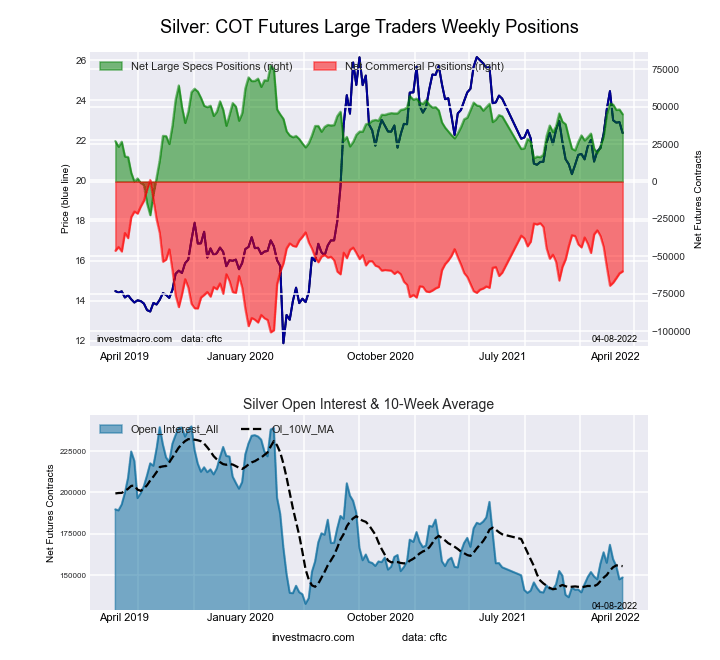
The Silver Comex Futures large speculator standing this week resulted in a net position of 45,034 contracts in the data reported through Tuesday. This was a weekly lowering of -3,206 contracts from the previous week which had a total of 48,240 net contracts.
This week’s current strength score (the trader positioning range over the past three years, measured from 0 to 100) shows the speculators are currently Bullish with a score of 67.3 percent. The commercials are Bearish with a score of 40.0 percent and the small traders (not shown in chart) are Bearish with a score of 30.2 percent.
Copper Grade #1 Futures
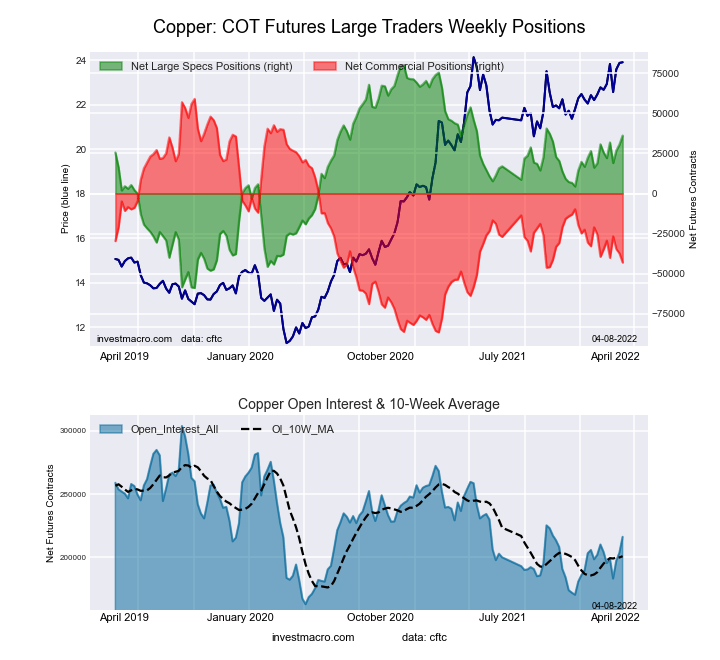
The Copper Grade #1 Futures large speculator standing this week resulted in a net position of 36,142 contracts in the data reported through Tuesday. This was a weekly boost of 5,561 contracts from the previous week which had a total of 30,581 net contracts.
This week’s current strength score (the trader positioning range over the past three years, measured from 0 to 100) shows the speculators are currently Bullish with a score of 68.4 percent. The commercials are Bearish with a score of 29.9 percent and the small traders (not shown in chart) are Bullish with a score of 65.2 percent.
Platinum Futures
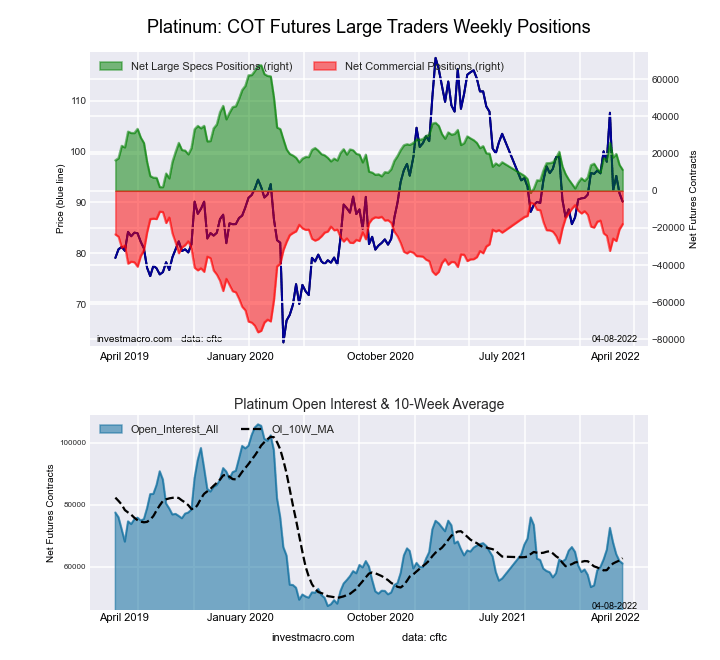
The Platinum Futures large speculator standing this week resulted in a net position of 11,290 contracts in the data reported through Tuesday. This was a weekly fall of -2,711 contracts from the previous week which had a total of 14,001 net contracts.
This week’s current strength score (the trader positioning range over the past three years, measured from 0 to 100) shows the speculators are currently Bearish-Extreme with a score of 18.0 percent. The commercials are Bullish-Extreme with a score of 83.4 percent and the small traders (not shown in the chart) are Bullish with a score of 54.3 percent.
Palladium Futures
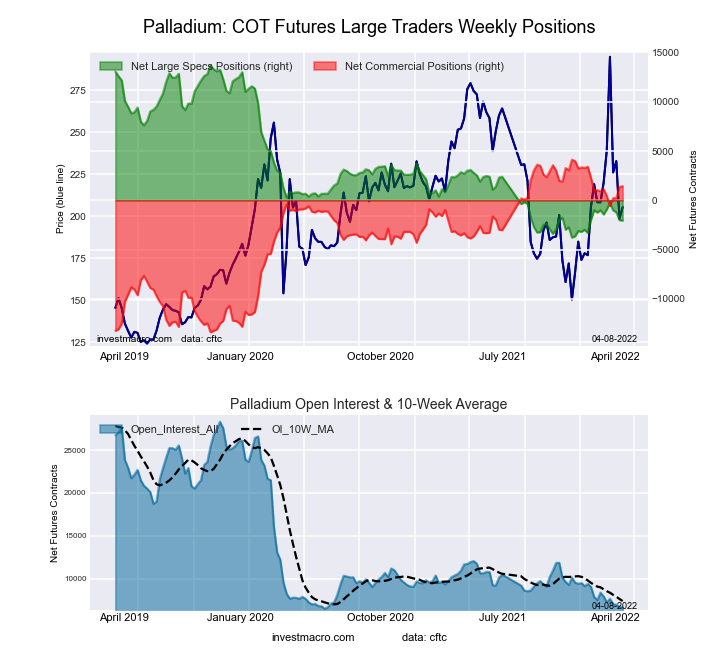
The Palladium Futures large speculator standing this week resulted in a net position of -2,041 contracts in the data reported through Tuesday. This was a weekly decrease of -30 contracts from the previous week which had a total of -2,011 net contracts.
This week’s current strength score (the trader positioning range over the past three years, measured from 0 to 100) shows the speculators are currently Bearish-Extreme with a score of 9.9 percent. The commercials are Bullish-Extreme with a score of 84.7 percent and the small traders (not shown in chart) are Bullish with a score of 78.5 percent.